The back-to-back NFL champions are poised for a third consecutive Super Bowl win (three-peat), which has never been accomplished before. Is such a feat possible due to unfair officiating? Let’s look at the data!
Published
January 31, 2025
Code
# Load Librariespacman::p_load("dplyr", # Data Manipulation"tidyr", # More Data Manipulation"ggplot2", # Data Visualization"nflverse", # NFL Data and Visualization"ggimage", # More Data Visualizationinstall =FALSE)# Define a Custom Theme - Taken From Andrew Heiss's Blogsblog_theme <-function() {theme_bw() +# Start with theme_bwtheme(panel.grid.minor =element_blank(),plot.background =element_rect(fill ="white", color =NA),plot.title =element_text(face ="bold"),axis.title =element_text(face ="bold"),strip.text =element_text(face ="bold"),strip.background =element_rect(fill ="grey80", color =NA),legend.title =element_text(face ="bold") )}# Clear Cache for NFL Datanflreadr::.clear_cache()
The Kansas City Chiefs are heading to their 5th Super Bowl in the past 6 years. This upcoming Super Bowl appearance against the Philadelphia Eagles is a re-match from two years ago, where the Chiefs emerged victorious. If the Chiefs can beat the Eagles again, they will go down in history as the first NFL team to win three consecutive Super Bowls (a “three-peat”).
Despite this unprecedented greatness, many fans, players, and coaches alike are skeptical. It seems that, week-after-week, a referee call just happens to go in the favor of Kansas City, and sometimes, these calls seem to impact the outcome of the game. This has lead to many fans and members of the NFL to question the integrity of the game.
In fairness, I don’t think that anyone is claiming that the Chiefs are cheating. Instead, the claim is that, for some reason, the NFL wants the Chiefs to do well, so they decide to give Kansas City small nudges here and there that go their way and inflate their probability of success. Primarily, skeptics claim the NFL does this by weaponizing the referee system. “It seems like the Chiefs get all of the calls” or “the calls just all happen to go KC’s way” or “the refs don’t call clear penalties against KC like they do towards other teams”. Is any of this true? Or have your eyes deceived you? I think so! And, if you don’t believe me, let’s dig into the data!
In this review, we are going to look at four major claims that people make and we’re going to see if the data supports such claims. First, outright, do the refs overall favor the Chiefs above any other team? Second, do the refs help out the Chiefs in “tight spots” when it really matters (3rd downs, 4th downs, overtime, etc.). Third, do the refs go out of their way to protect Patrick Mahomes in particular? And, lastly, does the NFL treat the Chiefs differently because of Taylor Swift and her relationship with Travis Kelce?
Claim 1: Do the Refs Help Out the Chiefs?
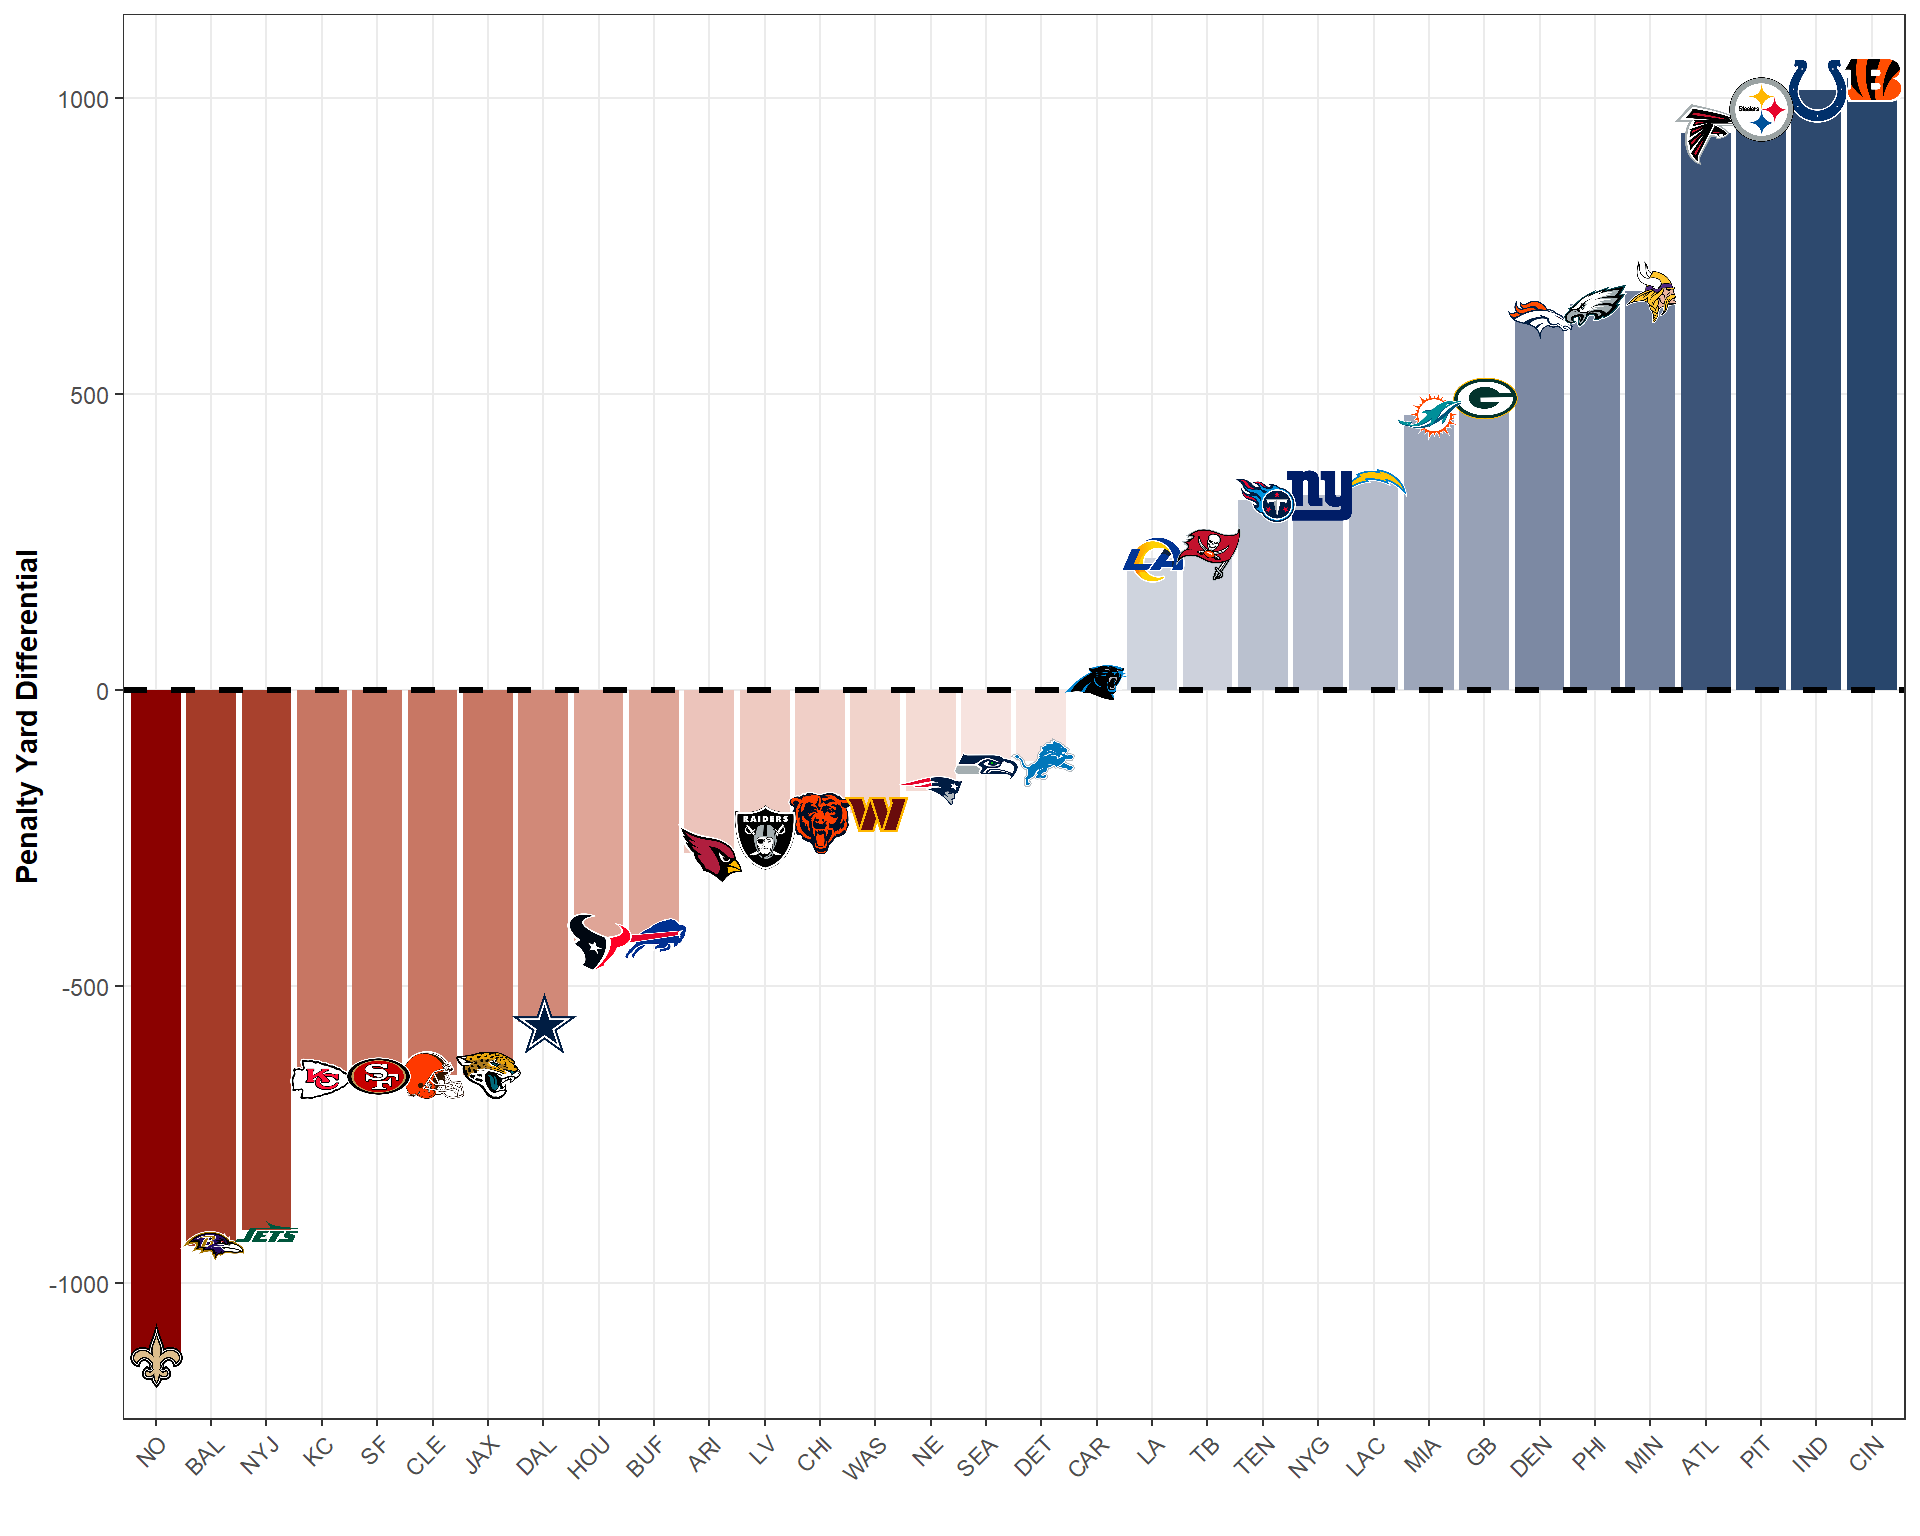
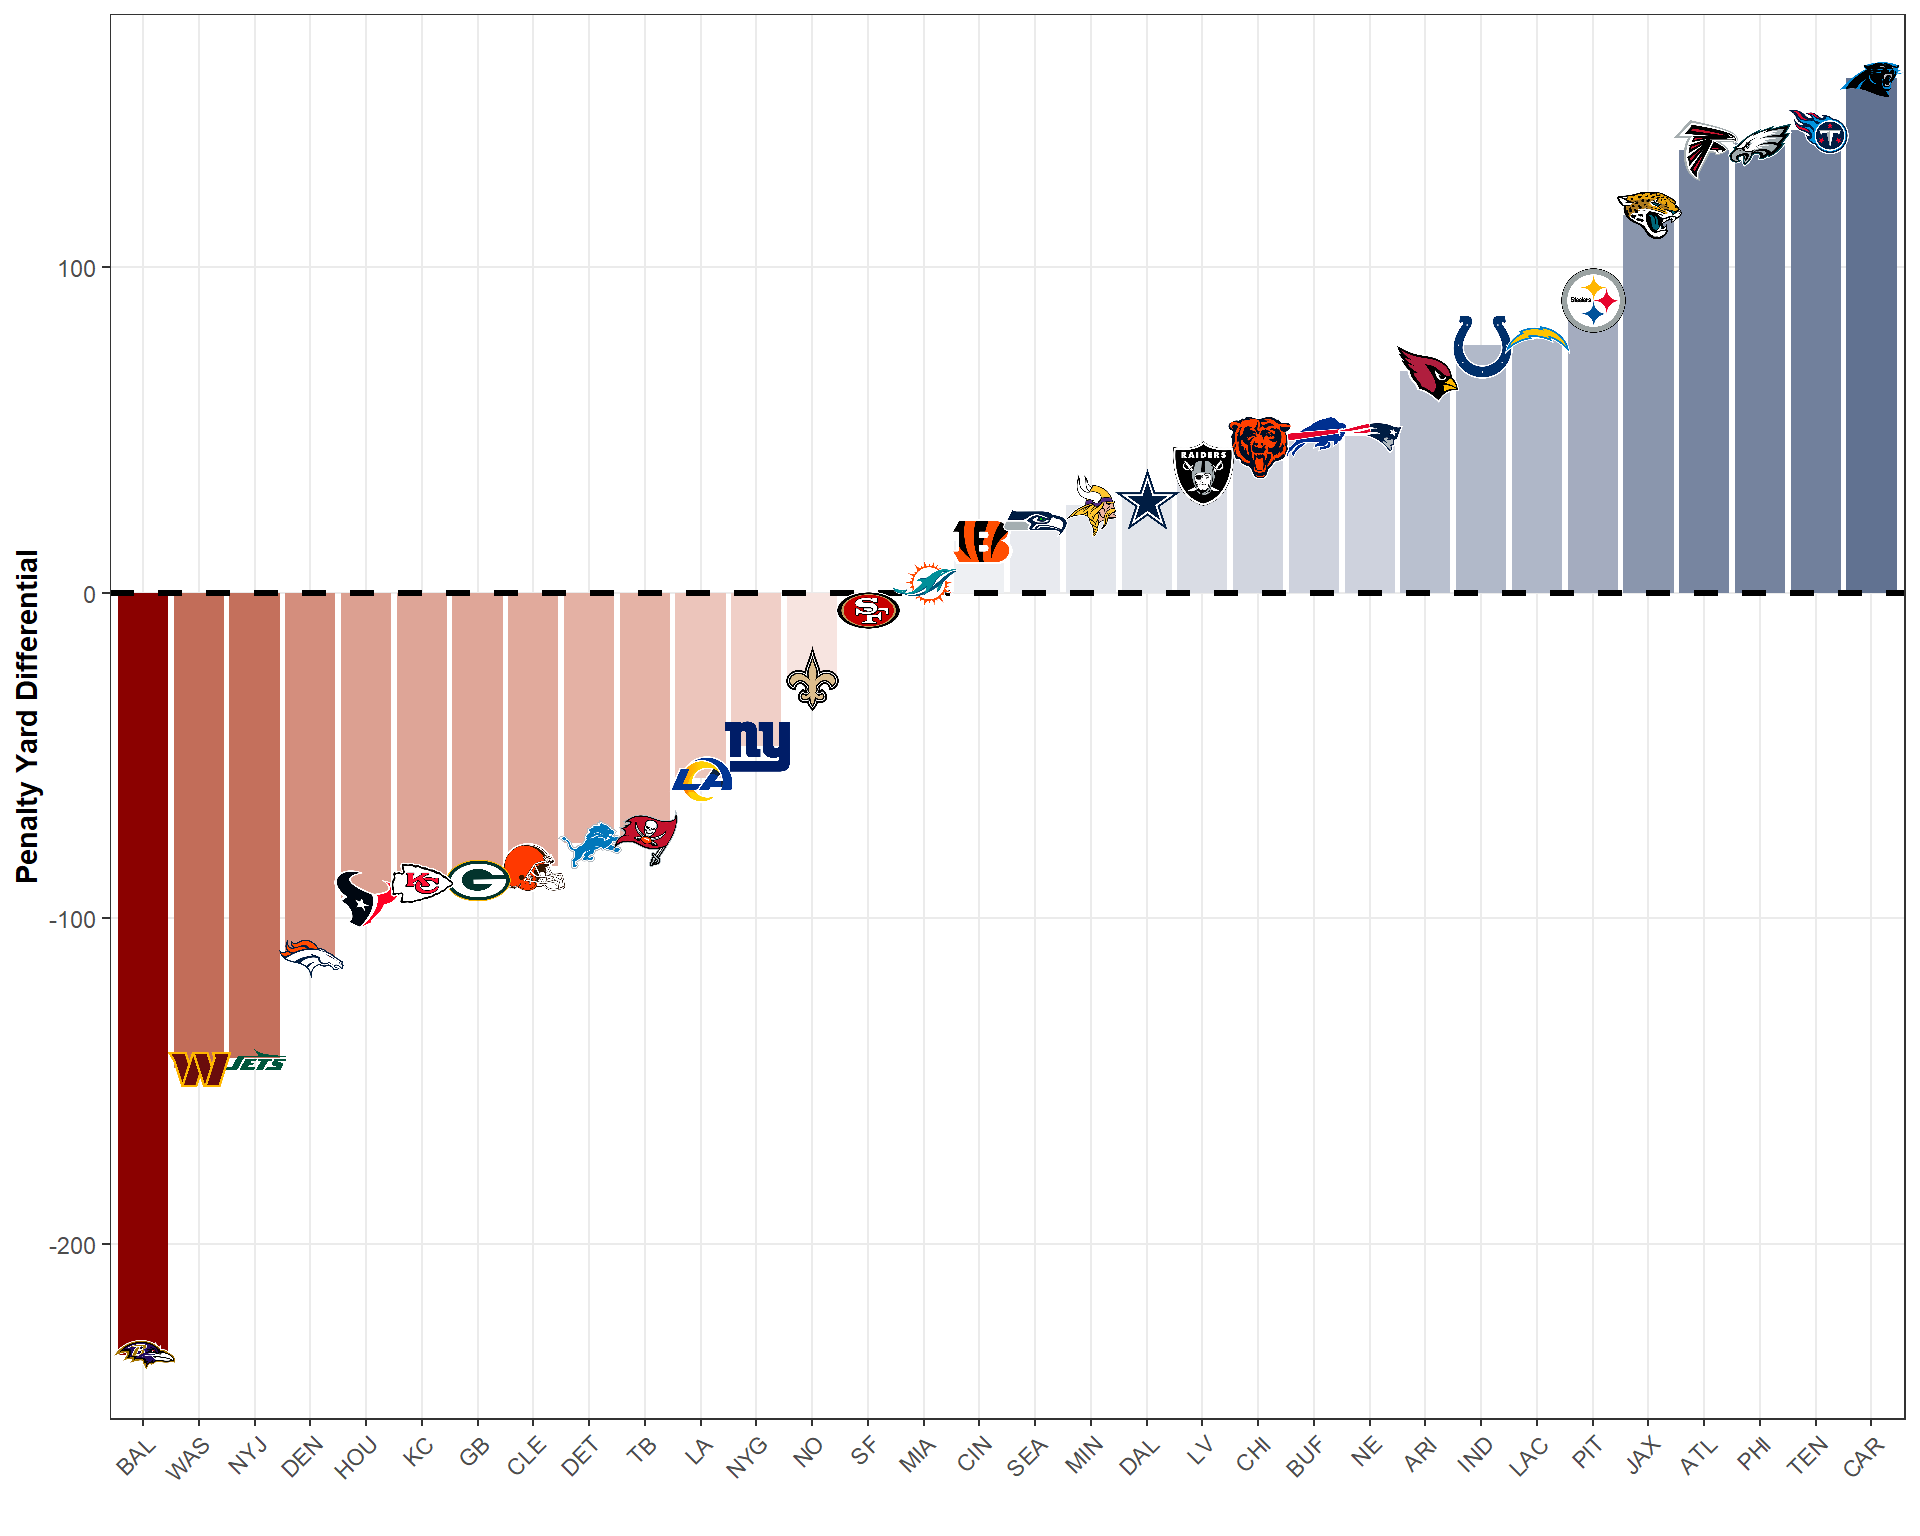
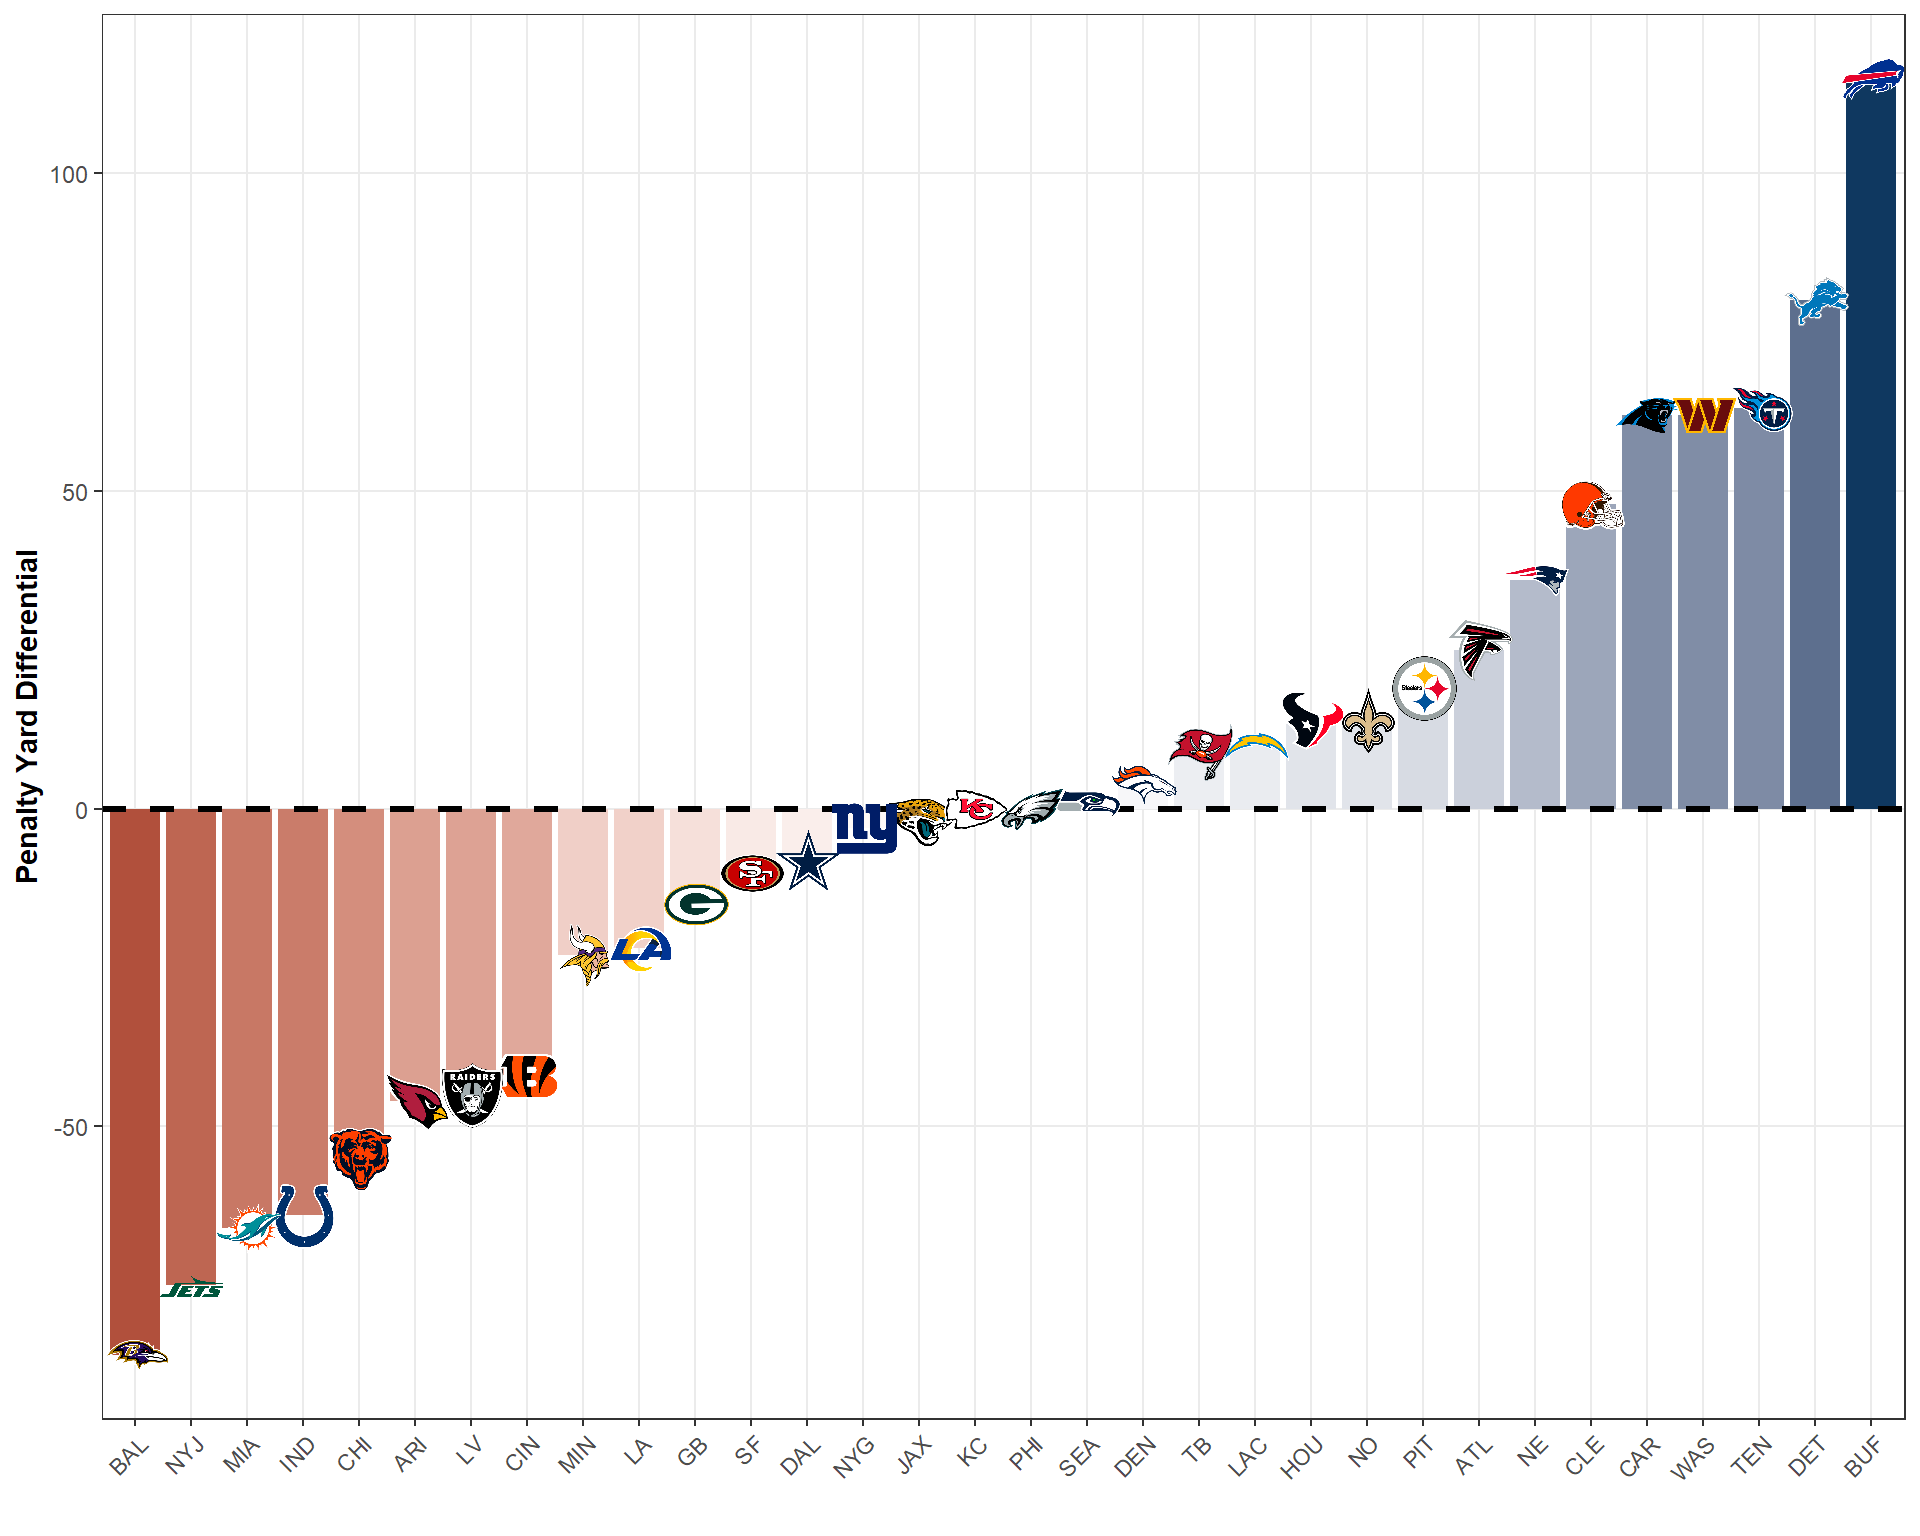
Let’s start looking into this claim by evaluating penalty yard differentials throughout Mahomes’s tenure as KC’s starting quarterback. Why penalty yard differential (PYD)? Here is the logic: while some calls may go your way in a given game, some calls will go the other way. What we care about is this: which team got helped out by the refs more? PYD is a way to evaluate that. If a team has a positive PYD, that means they got more yards awarded to them by the refs than the other team. If there is a negative PYD, the other team got more yards awarded to them from the refs. The larger the PYD, the greater the discrepancy.
Now, in a single game, you might either get unlucky, or your team was just poorly coached in that game and truly deserved all the penalties. That’s why we’re going to take a look overall, aggregating each game every team played from 2018-2024.
Code
# Load Play-by-Play (PBP) Datapbp_data_2018_2024 <-load_pbp(seasons =2018:2024)# Calculate Penalty Yard Differential by Teampenalty_differential_2018_2024 <- pbp_data_2018_2024 %>%# Only Keep Penalty Playsfilter(penalty ==1&!is.na(penalty_yards)) %>%# Create a Long Form Version with a "Team" Column and a Possession/Defense Dummygather(key ="side", value ="team", posteam, defteam) %>%mutate(side_dummy =ifelse(side =="posteam", "offense", "defense")) %>%# Modify Penalty Yards So That If the Team Committed the Penalty, It is Negative# For Them and Positive for Their Opponentmutate(penalty_yards_adjusted =case_when( penalty_team == team ~-penalty_yards, penalty_team != team ~ penalty_yards, TRUE~0 ) ) %>%# Collapse to the Game Levelgroup_by(game_id, team, season) %>%summarize(penalty_yard_differential =sum(penalty_yards_adjusted, na.rm =TRUE),.groups ='drop' ) %>%# Collapse to the Team Levelgroup_by(team) %>%summarize(total_penalty_yard_differential =sum(penalty_yard_differential, na.rm =TRUE),.groups ='drop' )# Add Team Logos for Plottingteam_logos <- nflfastR::teams_colors_logos %>%select(team_abbr, team_logo_espn)# Merge Penalty Data with Logospenalty_differential_2018_2024 <- penalty_differential_2018_2024 %>%left_join(team_logos, by =c("team"="team_abbr"))# Create a Diverging Bar Chartggplot(penalty_differential_2018_2024, aes(x =reorder(team, total_penalty_yard_differential), y = total_penalty_yard_differential)) +geom_bar(stat ="identity", aes(fill = total_penalty_yard_differential)) +geom_hline(yintercept =0, linetype ="dashed", color ="black", linewidth =1.2) +geom_image(aes(image = team_logo_espn), size =0.05) +scale_fill_gradient2(low ="#8b0100", high ="#0f3860",midpoint =0 ) +labs(x ="",y ="Penalty Yard Differential" ) +blog_theme() +theme(axis.text.x =element_text(angle =45, hjust =1),legend.position ="none")
Penalty Yard Differential by Team (2018-2024)
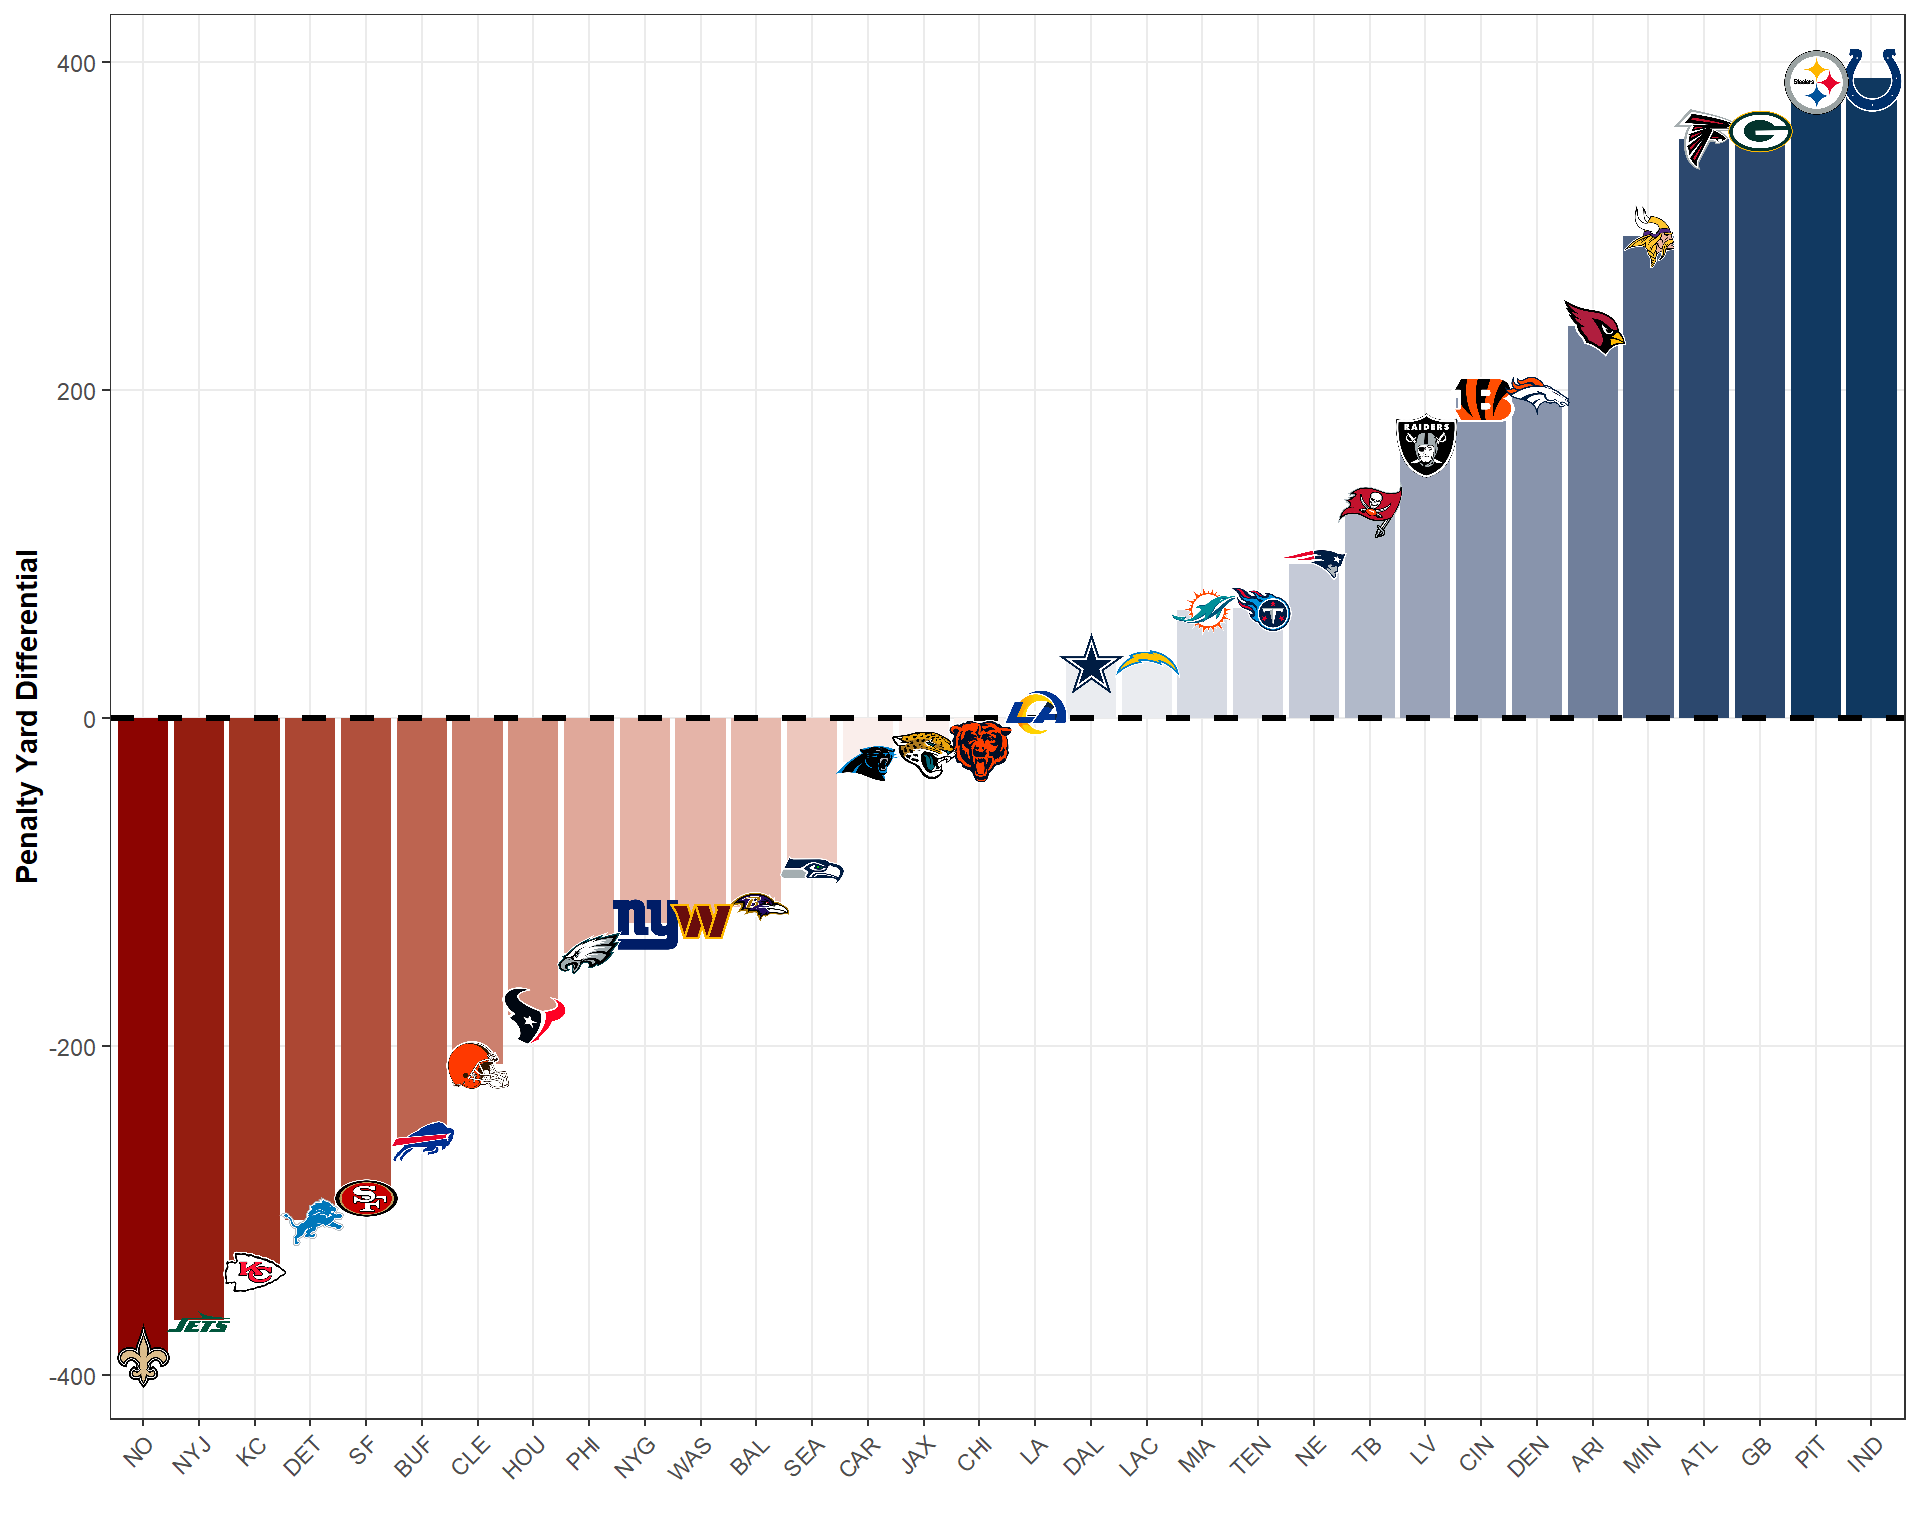
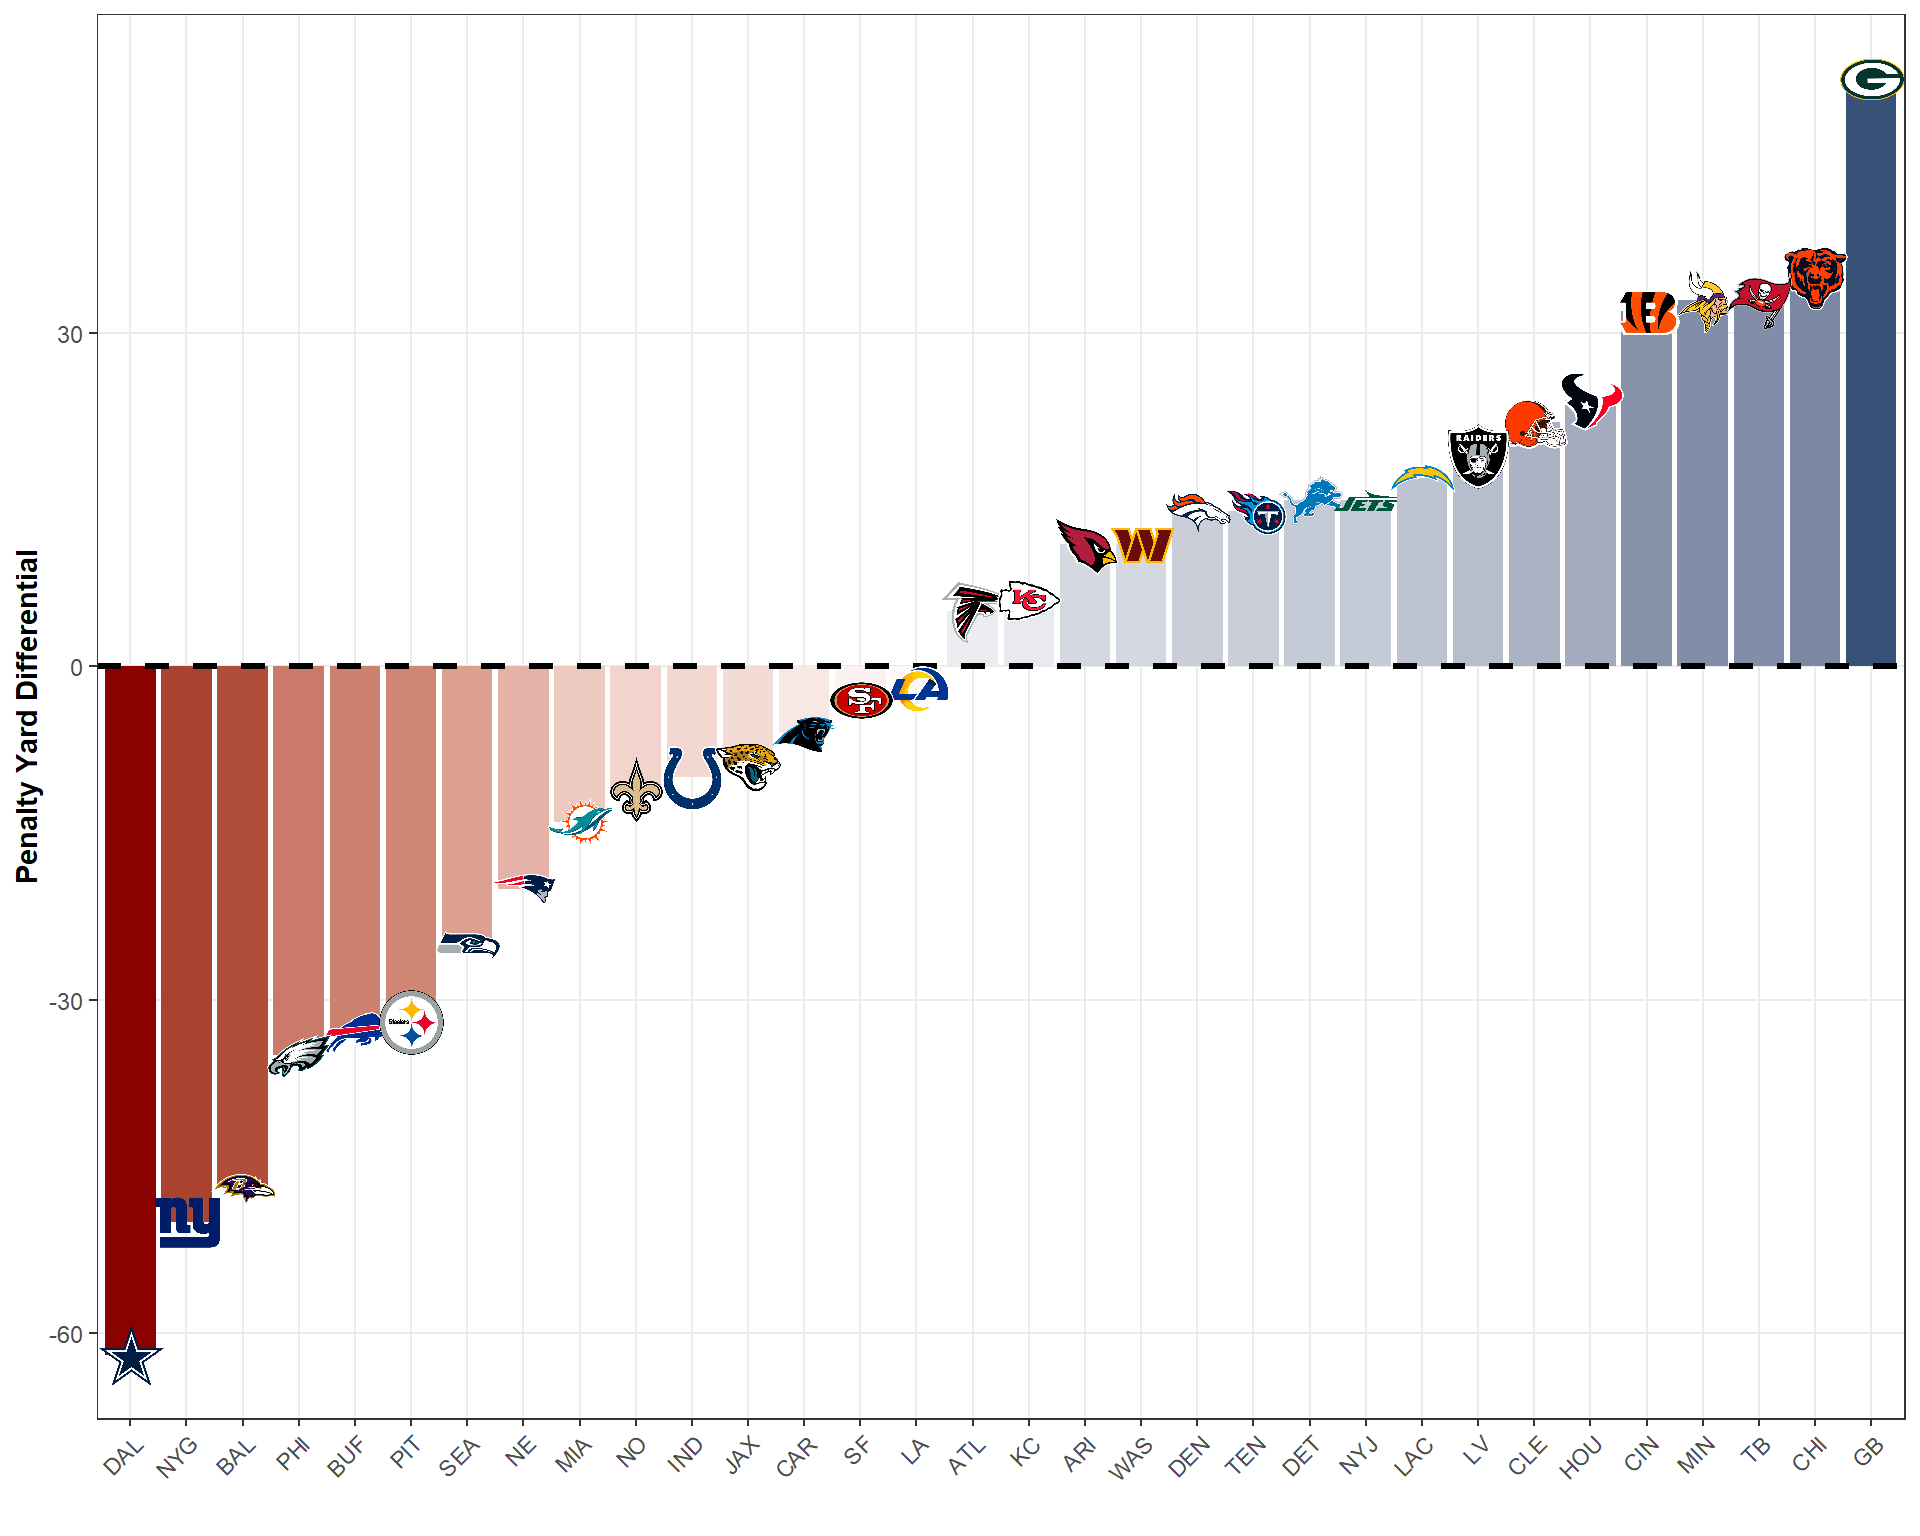
Now, that’s interesting! Not only is KC nowhere near the top of PYD over the past 7 years, they are near the very bottom! Okay, but you might think “back then, the Chiefs weren’t the favorites in the NFL, but now they are. And, I’ve watched their games all year this season and clearly see them getting bailed out by the refs.” Fair enough… so let’s look at PYD for just the 2024 NFL season.
Code
# Load Play-by-Play (PBP) Datapbp_data_2024 <-load_pbp(seasons =2024)# Calculate Penalty Yard Differential by Teampenalty_differential_2024 <- pbp_data_2024 %>%# Only Keep Penalty Playsfilter(penalty ==1&!is.na(penalty_yards)) %>%# Create a Long Form Version with a "Team" Column and a Possession/Defense Dummygather(key ="side", value ="team", posteam, defteam) %>%mutate(side_dummy =ifelse(side =="posteam", "offense", "defense")) %>%# Modify Penalty Yards So That If the Team Comitted the Penalty, It is Negative# For Them and Positive for Their Opponentmutate(penalty_yards_adjusted =case_when( penalty_team == team ~-penalty_yards, penalty_team != team ~ penalty_yards, TRUE~0 ) ) %>%# Collapse to the Game Levelgroup_by(game_id, team, season) %>%summarize(penalty_yard_differential =sum(penalty_yards_adjusted, na.rm =TRUE),.groups ='drop' ) %>%# Collapse to the Season Levelgroup_by(team) %>%summarize(total_penalty_yard_differential =sum(penalty_yard_differential, na.rm =TRUE),.groups ='drop' ) %>%left_join(team_logos, by =c("team"="team_abbr"))ggplot(penalty_differential_2024, aes(x =reorder(team, total_penalty_yard_differential), y = total_penalty_yard_differential)) +geom_bar(stat ="identity", aes(fill = total_penalty_yard_differential)) +geom_hline(yintercept =0, linetype ="dashed", color ="black", linewidth =1.2) +geom_image(aes(image = team_logo_espn), size =0.05) +scale_fill_gradient2(low ="#8b0100", high ="#0f3860",midpoint =0 ) +labs(x ="",y ="Penalty Yard Differential" ) +blog_theme() +theme(axis.text.x =element_text(angle =45, hjust =1),legend.position ="none")
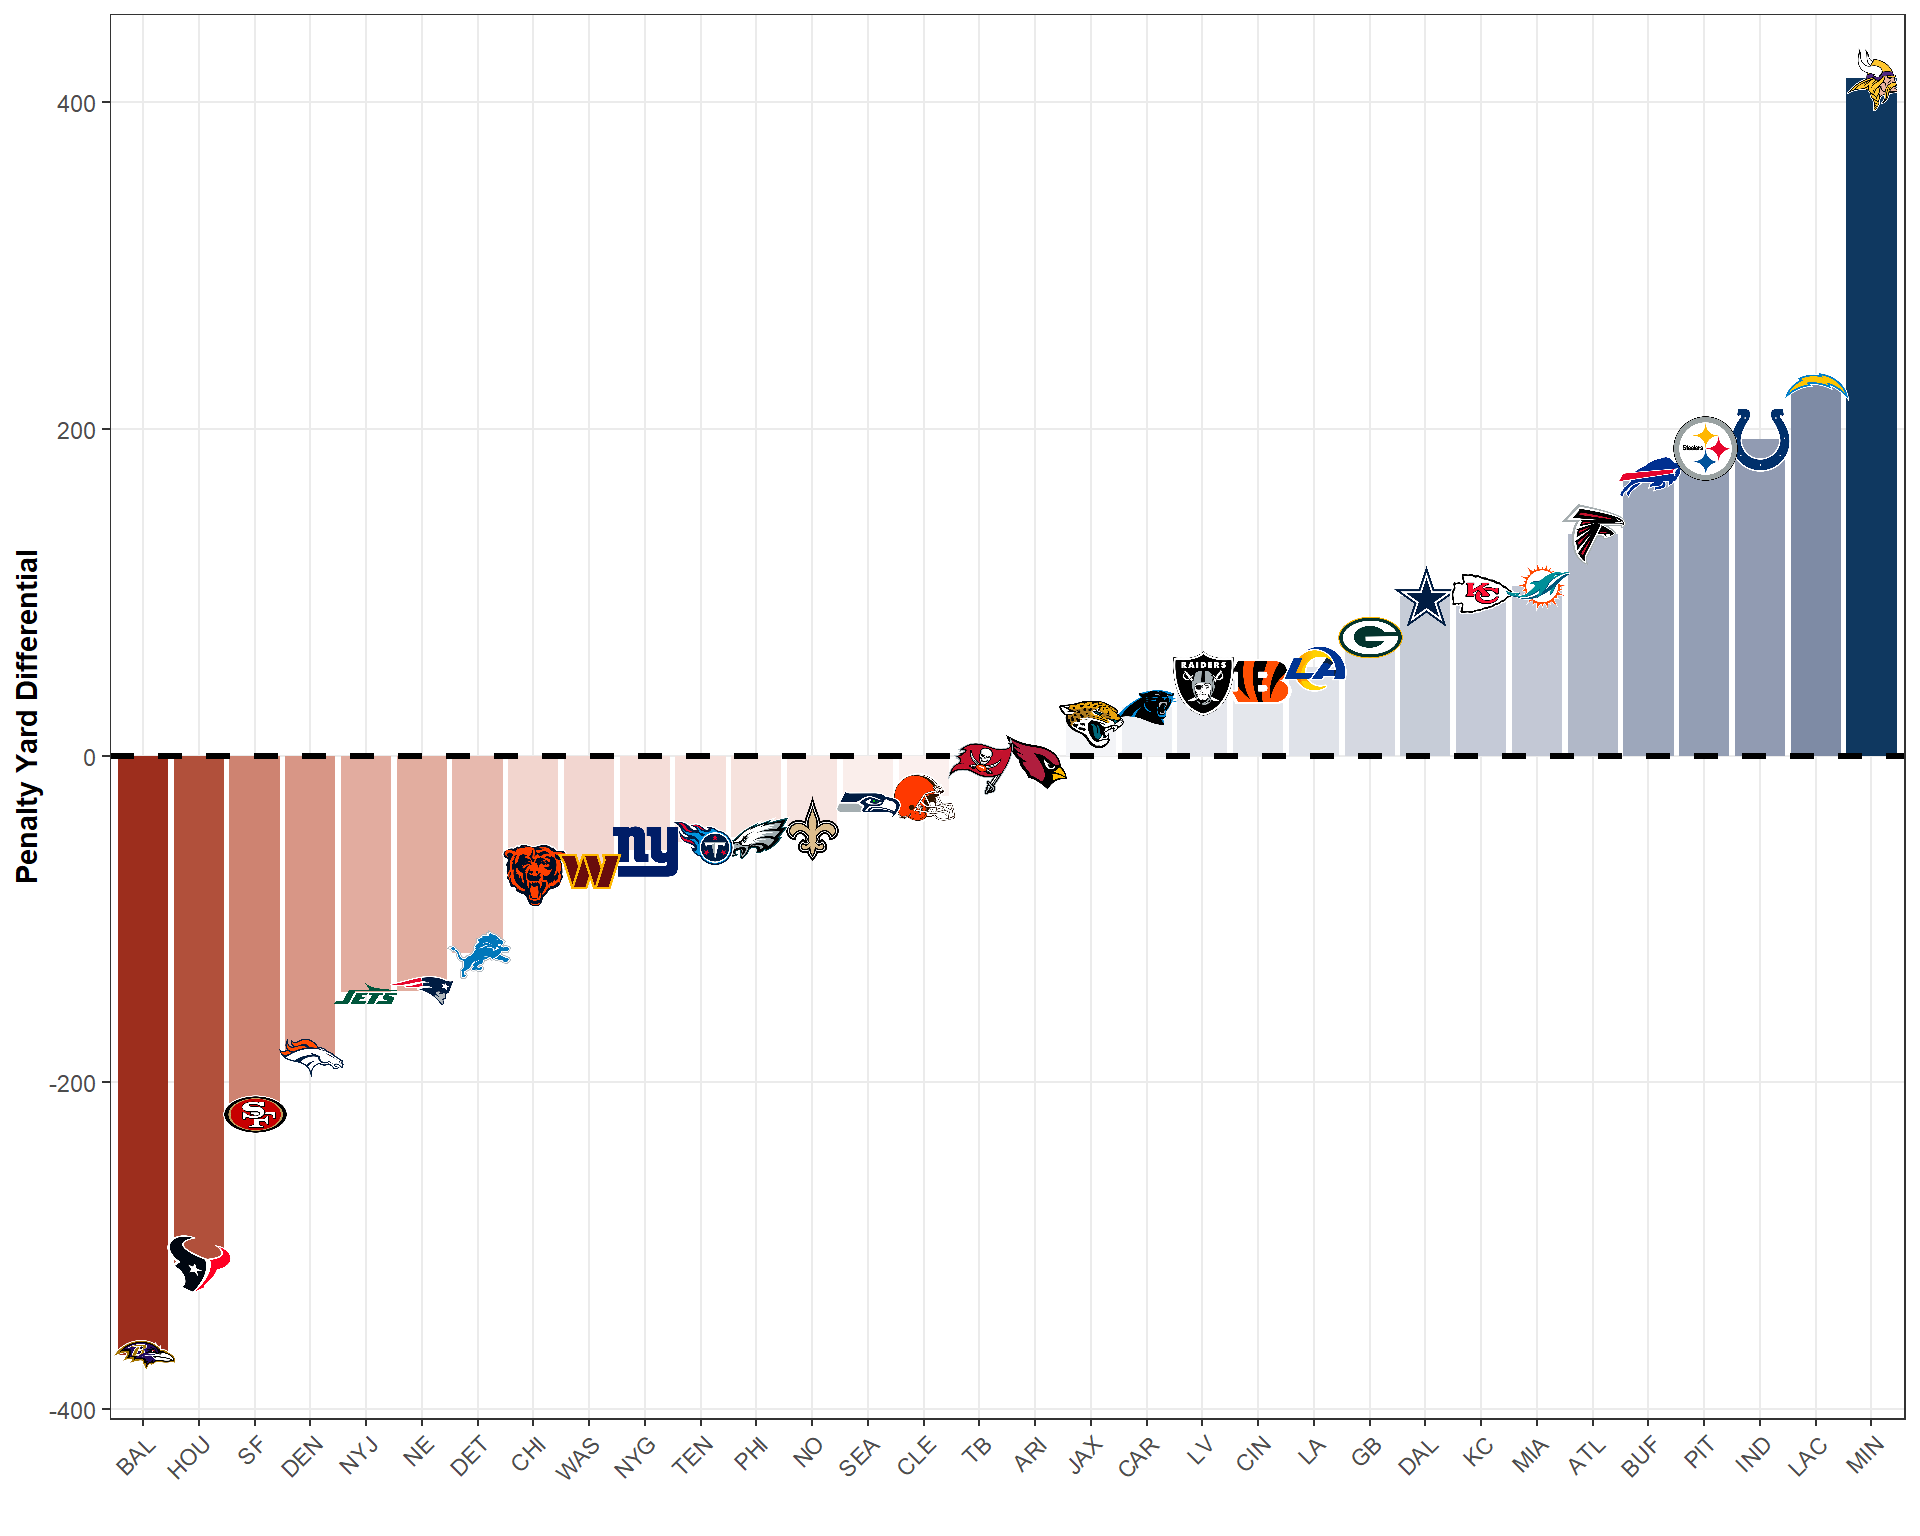
Penalty Yard Differential by Team (2024)
Look, the Chiefs are 8th in PYD for this season! Yes, they are. However, they are… only 8th… If the NFL is using the refs to help out KC, then are they also doing the same to help out their rivals like Buffalo? What about the Cinderella story of the Vikings this year? They are nowhere close to anyone else in positive PYD. Or, what about my Dallas Cowboys, who have a near identical PYD to the Chiefs? Is the NFL engaged in a conspiracy to help these teams out too? I don’t think so… So, we’ve seen that the Chiefs have a low PYD overall but had a high one this year. What about each year throughout Mahomes’s career?
Code
# Calculate Penalty Yard Differential by Teampenalty_differential_over_time <- pbp_data_2018_2024 %>%# Only Keep Penalty Playsfilter(penalty ==1&!is.na(penalty_yards)) %>%# Create a Long Form Version with a "Team" Column and a Possession/Defense Dummygather(key ="side", value ="team", posteam, defteam) %>%mutate(side_dummy =ifelse(side =="posteam", "offense", "defense")) %>%# Modify Penalty Yards So That If the Team Comitted the Penalty, It is Negative# For Them and Positive for Their Opponentmutate(penalty_yards_adjusted =case_when( penalty_team == team ~-penalty_yards, penalty_team != team ~ penalty_yards, TRUE~0 ) ) %>%# Collapse to the Game Levelgroup_by(game_id, team, season) %>%summarize(penalty_yard_differential =sum(penalty_yards_adjusted, na.rm =TRUE),.groups ='drop' ) %>%# Collapse to the Season Levelgroup_by(team, season) %>%summarize(total_penalty_yard_differential =sum(penalty_yard_differential, na.rm =TRUE),.groups ='drop' ) %>%left_join(team_logos, by =c("team"="team_abbr")) %>%filter(team =="KC")# Create a Time Series Plot of Chiefs Average and League Averageggplot(penalty_differential_over_time, aes(x = season, y = total_penalty_yard_differential)) +# Plot Chiefs Linegeom_line(color ="#E31837",linewidth =1 ) +geom_hline(yintercept =0, linetype ="dashed", color ="black", linewidth =1.2) +geom_image(aes(image = team_logo_espn), size =0.1) +labs(title ="",x ="",y ="Penalty Yard Differential", ) +scale_x_continuous(breaks =seq(2018, 2024, by =1)) +blog_theme() +theme(plot.title =element_text(hjust =0.5, face ="bold"),axis.text.x =element_text(angle =45, hjust =1),legend.position ="none" )
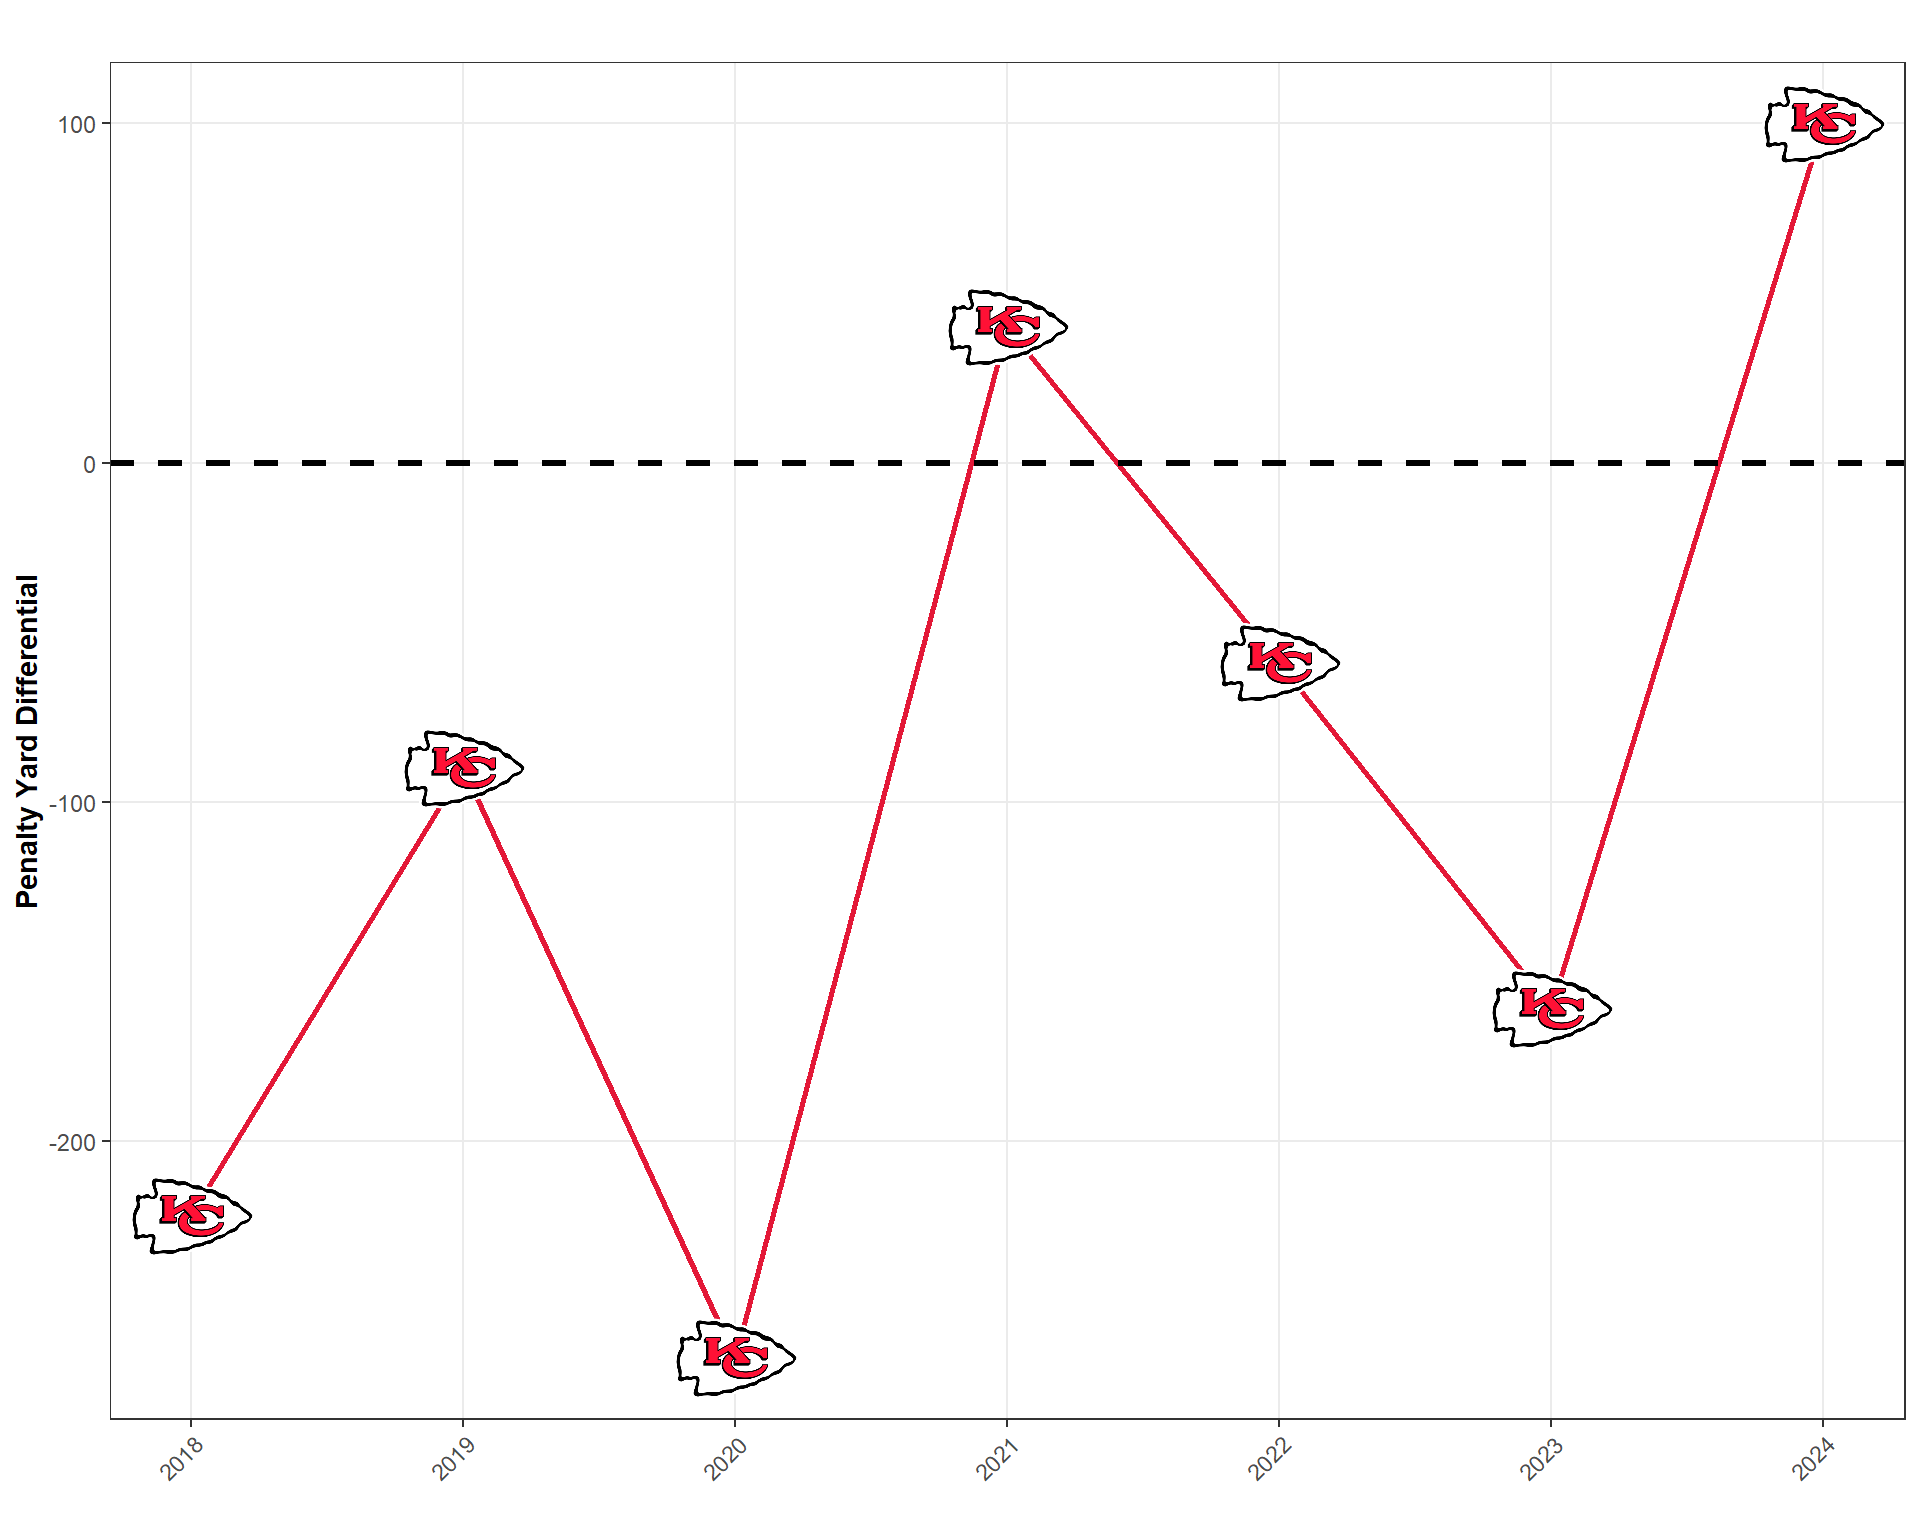
Chiefs Penalty Yard Differential Each Year (2018-2024)
Well, that’s not entirely compelling, is it? The Chiefs are pretty consistently negativley impacted by the refs. In fact, in their three seasons where they won the Super Bowl (2019, 2022, 2023) they had a negative PYD every season. If they beat the Eagles next week, it will be their first Super Bowl victory with a positive PYD. As you can see, this is not helping the anti-Chiefs case out so far. But, let’s take a deeper look into the context of the penalties themselves. After all, a holding call in the 1st Quarter of the game isn’t near as impactful as a holding call on 3rd down in a game-winning drive, right? So, let’s see if the refs help the Chiefs out in tight spots.
Claim 2: Do the Refs Help Out the Chiefs in Tight Spots?
We’ll start by looking at PYD during the 4th Quarter. Throughout Mahomes’s entire career, have the Chiefs been given a boost by the refs during the 4th Quarter?
Code
# Calculate Penalty Yard Differential by Teampenalty_differential_2018_2024_4th <- pbp_data_2018_2024 %>%filter(qtr ==4) %>%filter(penalty ==1) %>%# Create a Long Form Version with a "Team" Column and a Possession/Defense Dummygather(key ="side", value ="team", posteam, defteam) %>%mutate(side_dummy =ifelse(side =="posteam", "offense", "defense")) %>%# Modify Penalty Yards So That If the Team Committed the Penalty, It is Negative# For Them and Positive for Their Opponentmutate(penalty_yards_adjusted =case_when( penalty_team == team ~-penalty_yards, penalty_team != team ~ penalty_yards, TRUE~0 ) ) %>%# Collapse to the Game Levelgroup_by(game_id, team, season) %>%summarize(penalty_yard_differential =sum(penalty_yards_adjusted, na.rm =TRUE),.groups ='drop' ) %>%# Collapse to the Team Levelgroup_by(team) %>%summarize(total_penalty_yard_differential =sum(penalty_yard_differential, na.rm =TRUE),.groups ='drop' ) %>%left_join(team_logos, by =c("team"="team_abbr"))# Create a Diverging Bar Chartggplot(penalty_differential_2018_2024_4th, aes(x =reorder(team, total_penalty_yard_differential), y = total_penalty_yard_differential)) +geom_bar(stat ="identity", aes(fill = total_penalty_yard_differential)) +geom_hline(yintercept =0, linetype ="dashed", color ="black", linewidth =1.2) +geom_image(aes(image = team_logo_espn), size =0.05) +scale_fill_gradient2(low ="#8b0100", high ="#0f3860",midpoint =0 ) +labs(x ="",y ="Penalty Yard Differential" ) +blog_theme() +theme(axis.text.x =element_text(angle =45, hjust =1),legend.position ="none")
Chiefs Penalty Yard Differential in the 4th Quarter (2018-2024)
Yet again, we see the Chiefs near the bottom. But let’s see if that was any different this season in particular when all of the noise around the Chiefs and the refs exploded.
Code
# Calculate Penalty Yard Differential by Teampenalty_differential_2024_4th <- pbp_data_2024 %>%filter(qtr ==4) %>%# Only Keep Penalty Playsfilter(penalty ==1&!is.na(penalty_yards)) %>%# Create a Long Form Version with a "Team" Column and a Possession/Defense Dummygather(key ="side", value ="team", posteam, defteam) %>%mutate(side_dummy =ifelse(side =="posteam", "offense", "defense")) %>%# Modify Penalty Yards So That If the Team Comitted the Penalty, It is Negative# For Them and Positive for Their Opponentmutate(penalty_yards_adjusted =case_when( penalty_team == team ~-penalty_yards, penalty_team != team ~ penalty_yards, TRUE~0 ) ) %>%# Collapse to the Game Levelgroup_by(game_id, team, season) %>%summarize(penalty_yard_differential =sum(penalty_yards_adjusted, na.rm =TRUE),.groups ='drop' ) %>%# Collapse to the Season Levelgroup_by(team) %>%summarize(total_penalty_yard_differential =sum(penalty_yard_differential, na.rm =TRUE),.groups ='drop' ) %>%left_join(team_logos, by =c("team"="team_abbr"))# Create a Diverging Bar Chartggplot(penalty_differential_2024_4th, aes(x =reorder(team, total_penalty_yard_differential), y = total_penalty_yard_differential)) +geom_bar(stat ="identity", aes(fill = total_penalty_yard_differential)) +geom_hline(yintercept =0, linetype ="dashed", color ="black", linewidth =1.2) +geom_image(aes(image = team_logo_espn), size =0.05) +scale_fill_gradient2(low ="#8b0100", high ="#0f3860",midpoint =0 ) +labs(x ="",y ="Penalty Yard Differential" ) +blog_theme() +theme(axis.text.x =element_text(angle =45, hjust =1),legend.position ="none")
Chiefs Penalty Yard Differential in the 4th Quarter (2024)
Yep, about what I expected. Even during this season, the refs still give KC’s opponents more penalty yards in the 4th Quarter than the Chiefs. Next, we’re going to shift our attention towards downs. In particular, both 3rd and 4th downs since converting these are very important for sustaining drives and preventing turnover on downs.
Code
# Calculate Penalty Yard Differential by Teampenalty_differential_2018_2024_3d <- pbp_data_2018_2024 %>%filter(down ==3) %>%# Only Keep Penalty Playsfilter(penalty ==1&!is.na(penalty_yards)) %>%# Create a Long Form Version with a "Team" Column and a Possession/Defense Dummygather(key ="side", value ="team", posteam, defteam) %>%mutate(side_dummy =ifelse(side =="posteam", "offense", "defense")) %>%# Modify Penalty Yards So That If the Team Committed the Penalty, It is Negative# For Them and Positive for Their Opponentmutate(penalty_yards_adjusted =case_when( penalty_team == team ~-penalty_yards, penalty_team != team ~ penalty_yards, TRUE~0 ) ) %>%# Collapse to the Game Levelgroup_by(game_id, team, season) %>%summarize(penalty_yard_differential =sum(penalty_yards_adjusted, na.rm =TRUE),.groups ='drop' ) %>%# Collapse to the Team Levelgroup_by(team) %>%summarize(total_penalty_yard_differential =sum(penalty_yard_differential, na.rm =TRUE),.groups ='drop' ) %>%left_join(team_logos, by =c("team"="team_abbr"))# Create a Diverging Bar Chartggplot(penalty_differential_2018_2024_3d, aes(x =reorder(team, total_penalty_yard_differential), y = total_penalty_yard_differential)) +geom_bar(stat ="identity", aes(fill = total_penalty_yard_differential)) +geom_hline(yintercept =0, linetype ="dashed", color ="black", linewidth =1.2) +geom_image(aes(image = team_logo_espn), size =0.05) +scale_fill_gradient2(low ="#8b0100", high ="#0f3860",midpoint =0 ) +labs(x ="",y ="Penalty Yard Differential" ) +blog_theme() +theme(axis.text.x =element_text(angle =45, hjust =1),legend.position ="none")
Chiefs Penalty Yard Differential on 3rd Down (2018-2024)
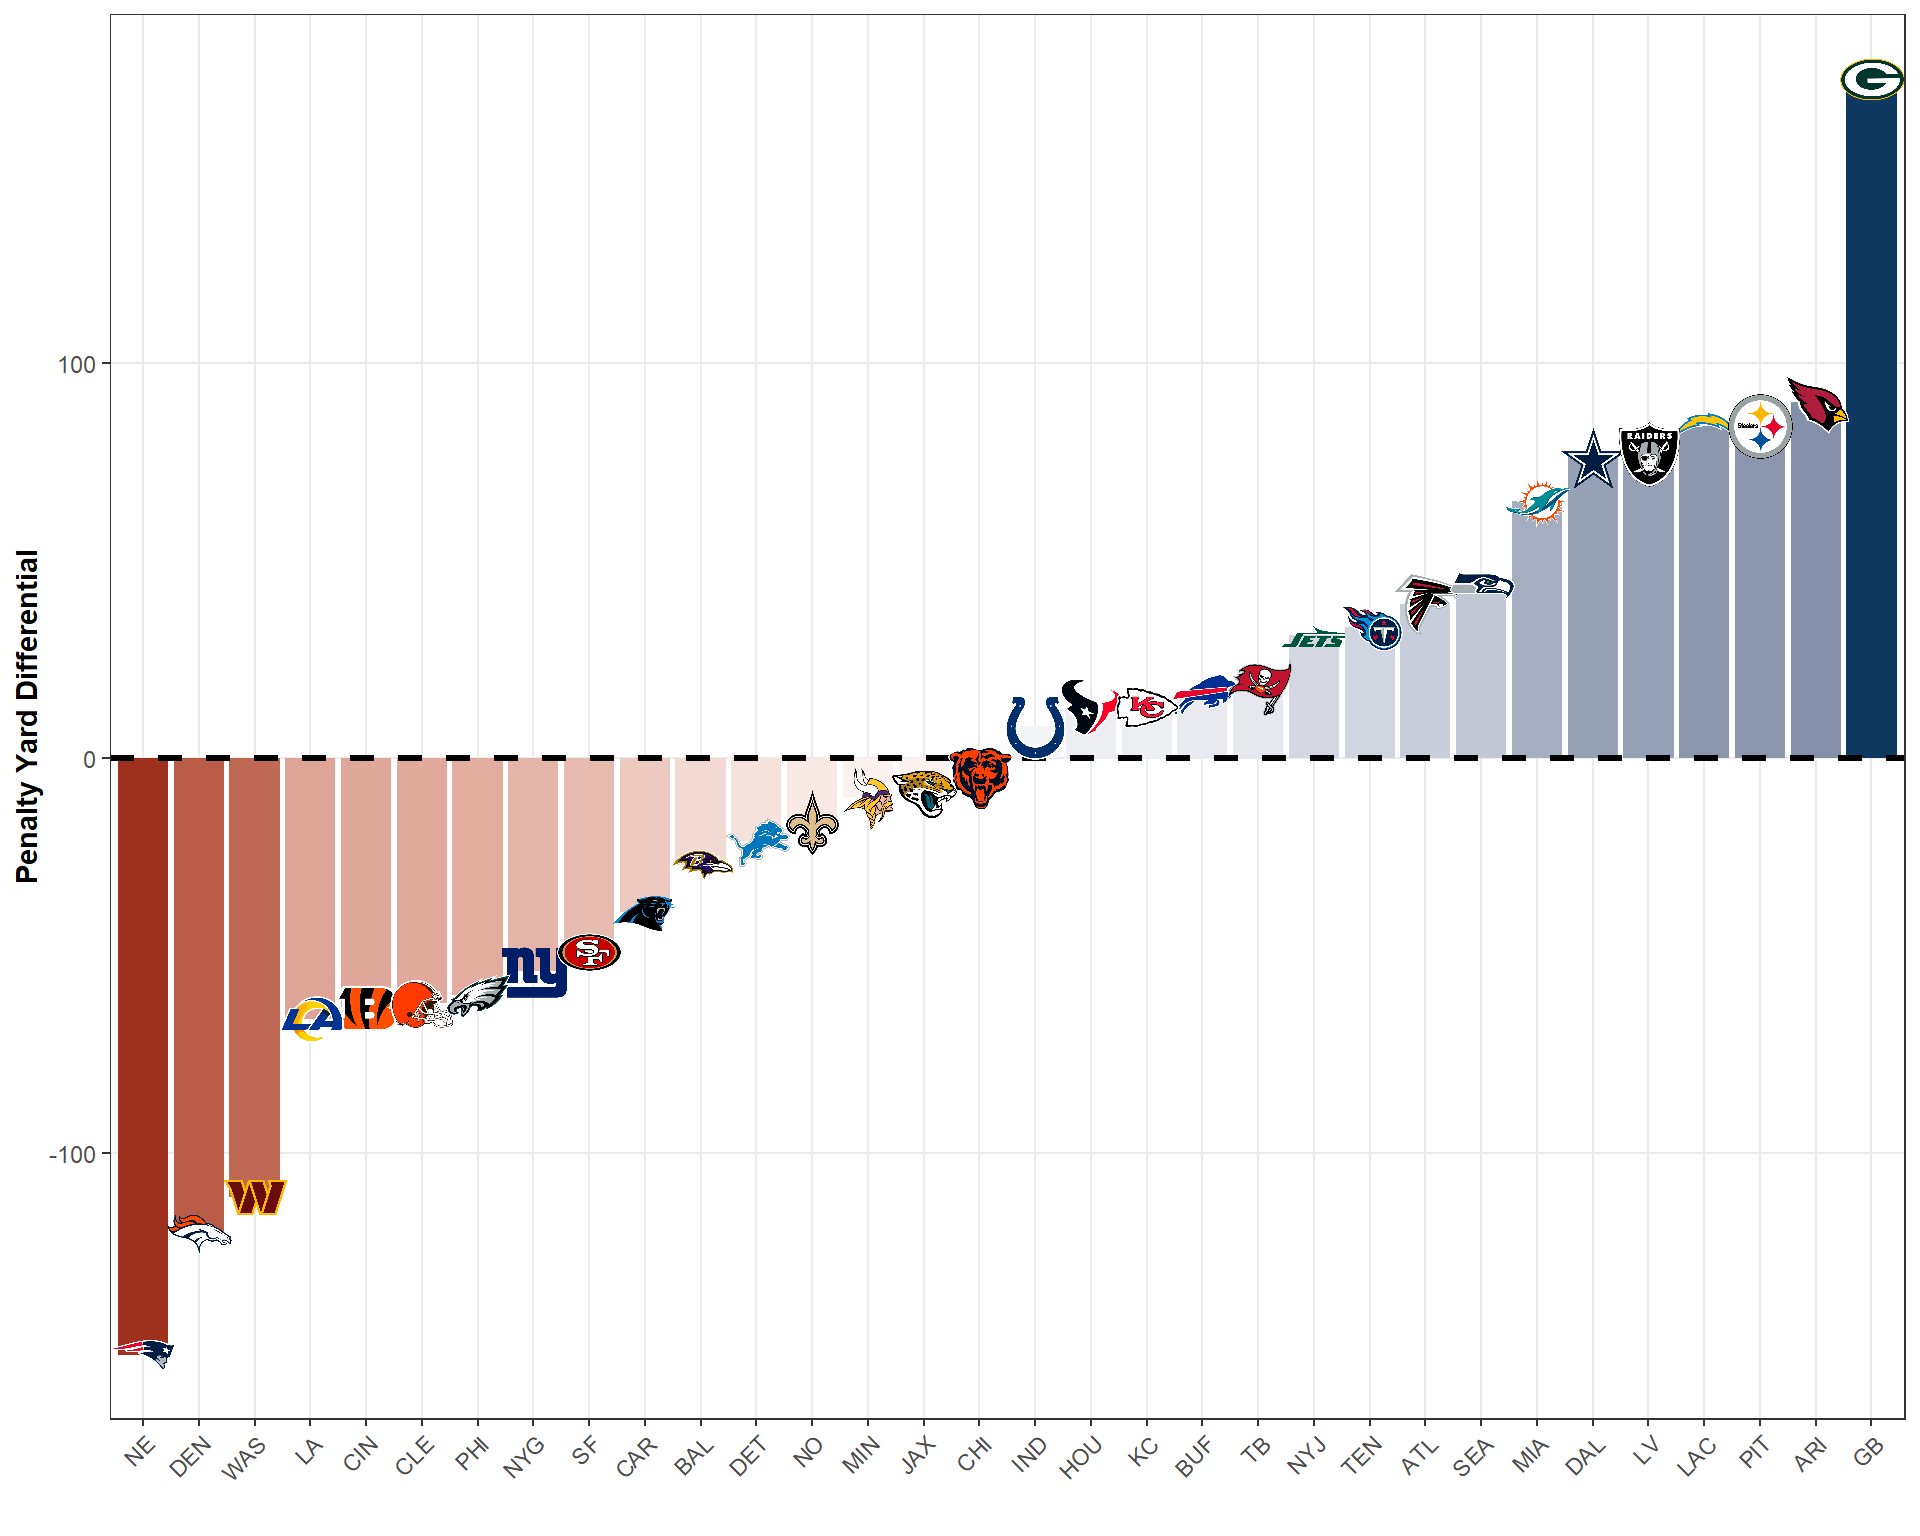
No shocker here… KC ranks 3rd to last on PYD on 3rd down throughout Mahomes’s career and, as you can see in the plot below, the Chiefs are basically right in the middle for the 2024 season.
Code
# Calculate Penalty Yard Differential by Teampenalty_differential_2024_3d <- pbp_data_2024 %>%filter(down ==3) %>%# Only Keep Penalty Playsfilter(penalty ==1&!is.na(penalty_yards)) %>%# Create a Long Form Version with a "Team" Column and a Possession/Defense Dummygather(key ="side", value ="team", posteam, defteam) %>%mutate(side_dummy =ifelse(side =="posteam", "offense", "defense")) %>%# Modify Penalty Yards So That If the Team Comitted the Penalty, It is Negative# For Them and Positive for Their Opponentmutate(penalty_yards_adjusted =case_when( penalty_team == team ~-penalty_yards, penalty_team != team ~ penalty_yards, TRUE~0 ) ) %>%# Collapse to the Game Levelgroup_by(game_id, team, season) %>%summarize(penalty_yard_differential =sum(penalty_yards_adjusted, na.rm =TRUE),.groups ='drop' ) %>%# Collapse to the Season Levelgroup_by(team) %>%summarize(total_penalty_yard_differential =sum(penalty_yard_differential, na.rm =TRUE),.groups ='drop' ) %>%left_join(team_logos, by =c("team"="team_abbr"))# Create a Diverging Bar Chartggplot(penalty_differential_2024_3d, aes(x =reorder(team, total_penalty_yard_differential), y = total_penalty_yard_differential)) +geom_bar(stat ="identity", aes(fill = total_penalty_yard_differential)) +geom_hline(yintercept =0, linetype ="dashed", color ="black", linewidth =1.2) +geom_image(aes(image = team_logo_espn), size =0.05) +scale_fill_gradient2(low ="#8b0100", high ="#0f3860",midpoint =0 ) +labs(x ="",y ="Penalty Yard Differential" ) +blog_theme() +theme(axis.text.x =element_text(angle =45, hjust =1),legend.position ="none")
Chiefs Penalty Yard Differential on 3rd Down (2024)
What about fourth downs?
Code
# Calculate Penalty Yard Differential by Teampenalty_differential_2018_2024_4d <- pbp_data_2018_2024 %>%filter(down ==4) %>%# Only Keep Penalty Playsfilter(penalty ==1&!is.na(penalty_yards)) %>%# Create a Long Form Version with a "Team" Column and a Possession/Defense Dummygather(key ="side", value ="team", posteam, defteam) %>%mutate(side_dummy =ifelse(side =="posteam", "offense", "defense")) %>%# Modify Penalty Yards So That If the Team Committed the Penalty, It is Negative# For Them and Positive for Their Opponentmutate(penalty_yards_adjusted =case_when( penalty_team == team ~-penalty_yards, penalty_team != team ~ penalty_yards, TRUE~0 ) ) %>%# Collapse to the Game Levelgroup_by(game_id, team, season) %>%summarize(penalty_yard_differential =sum(penalty_yards_adjusted, na.rm =TRUE),.groups ='drop' ) %>%# Collapse to the Team Levelgroup_by(team) %>%summarize(total_penalty_yard_differential =sum(penalty_yard_differential, na.rm =TRUE),.groups ='drop' ) %>%left_join(team_logos, by =c("team"="team_abbr"))# Create a Diverging Bar Chartggplot(penalty_differential_2018_2024_4d, aes(x =reorder(team, total_penalty_yard_differential), y = total_penalty_yard_differential)) +geom_bar(stat ="identity", aes(fill = total_penalty_yard_differential)) +geom_hline(yintercept =0, linetype ="dashed", color ="black", linewidth =1.2) +geom_image(aes(image = team_logo_espn), size =0.05) +scale_fill_gradient2(low ="#8b0100", high ="#0f3860",midpoint =0 ) +labs(x ="",y ="Penalty Yard Differential" ) +blog_theme() +theme(axis.text.x =element_text(angle =45, hjust =1),legend.position ="none")
Chiefs Penalty Yard Differential on 4th Down (2018-2024)
The Chiefs are dead-last for Mahomes’s career (lol) and right in the center for 2024, which largely tracks with the PYD on 3rd down.
Code
# Calculate Penalty Yard Differential by Teampenalty_differential_2024_4d <- pbp_data_2024 %>%filter(down ==4) %>%# Only Keep Penalty Playsfilter(penalty ==1&!is.na(penalty_yards)) %>%# Create a Long Form Version with a "Team" Column and a Possession/Defense Dummygather(key ="side", value ="team", posteam, defteam) %>%mutate(side_dummy =ifelse(side =="posteam", "offense", "defense")) %>%# Modify Penalty Yards So That If the Team Comitted the Penalty, It is Negative# For Them and Positive for Their Opponentmutate(penalty_yards_adjusted =case_when( penalty_team == team ~-penalty_yards, penalty_team != team ~ penalty_yards, TRUE~0 ) ) %>%# Collapse to the Game Levelgroup_by(game_id, team, season) %>%summarize(penalty_yard_differential =sum(penalty_yards_adjusted, na.rm =TRUE),.groups ='drop' ) %>%# Collapse to the Season Levelgroup_by(team) %>%summarize(total_penalty_yard_differential =sum(penalty_yard_differential, na.rm =TRUE),.groups ='drop' ) %>%left_join(team_logos, by =c("team"="team_abbr"))# Create a Diverging Bar Chartggplot(penalty_differential_2024_4d, aes(x =reorder(team, total_penalty_yard_differential), y = total_penalty_yard_differential)) +geom_bar(stat ="identity", aes(fill = total_penalty_yard_differential)) +geom_hline(yintercept =0, linetype ="dashed", color ="black", linewidth =1.2) +geom_image(aes(image = team_logo_espn), size =0.05) +scale_fill_gradient2(low ="#8b0100", high ="#0f3860",midpoint =0 ) +labs(x ="",y ="Penalty Yard Differential" ) +blog_theme() +theme(axis.text.x =element_text(angle =45, hjust =1),legend.position ="none")
Chiefs Penalty Yard Differential on 4th Down (2024)
But, what about overtime? Maybe we can finally find some bit of evidence that the refs favor the Chiefs in a high-stakes situation? Nope, as you can see below, the Chiefs are just barely above average for PYD in OT. Note that I am not showing OT data for just the 2024t season because a lot of teams never went into OT this season and, among those who did, they only went once. So, the sample sizes are much too small to be useful. However, looking in the aggregate over 7 seasons yields some insight.
Code
# Calculate Penalty Yard Differential by Teampenalty_differential_2018_2024_OT <- pbp_data_2018_2024 %>%filter(qtr ==5) %>%# Only Keep Penalty Playsfilter(penalty ==1&!is.na(penalty_yards)) %>%# Create a Long Form Version with a "Team" Column and a Possession/Defense Dummygather(key ="side", value ="team", posteam, defteam) %>%mutate(side_dummy =ifelse(side =="posteam", "offense", "defense")) %>%# Modify Penalty Yards So That If the Team Committed the Penalty, It is Negative# For Them and Positive for Their Opponentmutate(penalty_yards_adjusted =case_when( penalty_team == team ~-penalty_yards, penalty_team != team ~ penalty_yards, TRUE~0 ) ) %>%# Collapse to the Game Levelgroup_by(game_id, team, season) %>%summarize(penalty_yard_differential =sum(penalty_yards_adjusted, na.rm =TRUE),.groups ='drop' ) %>%# Collapse to the Team Levelgroup_by(team) %>%summarize(total_penalty_yard_differential =sum(penalty_yard_differential, na.rm =TRUE),.groups ='drop' ) %>%left_join(team_logos, by =c("team"="team_abbr"))# Create a Diverging Bar Chartggplot(penalty_differential_2018_2024_OT, aes(x =reorder(team, total_penalty_yard_differential), y = total_penalty_yard_differential)) +geom_bar(stat ="identity", aes(fill = total_penalty_yard_differential)) +geom_hline(yintercept =0, linetype ="dashed", color ="black", linewidth =1.2) +geom_image(aes(image = team_logo_espn), size =0.05) +scale_fill_gradient2(low ="#8b0100", high ="#0f3860",midpoint =0 ) +labs(x ="",y ="Penalty Yard Differential" ) +blog_theme() +theme(axis.text.x =element_text(angle =45, hjust =1),legend.position ="none")
Penalty Yard Differential in Over Time (2018-2024)
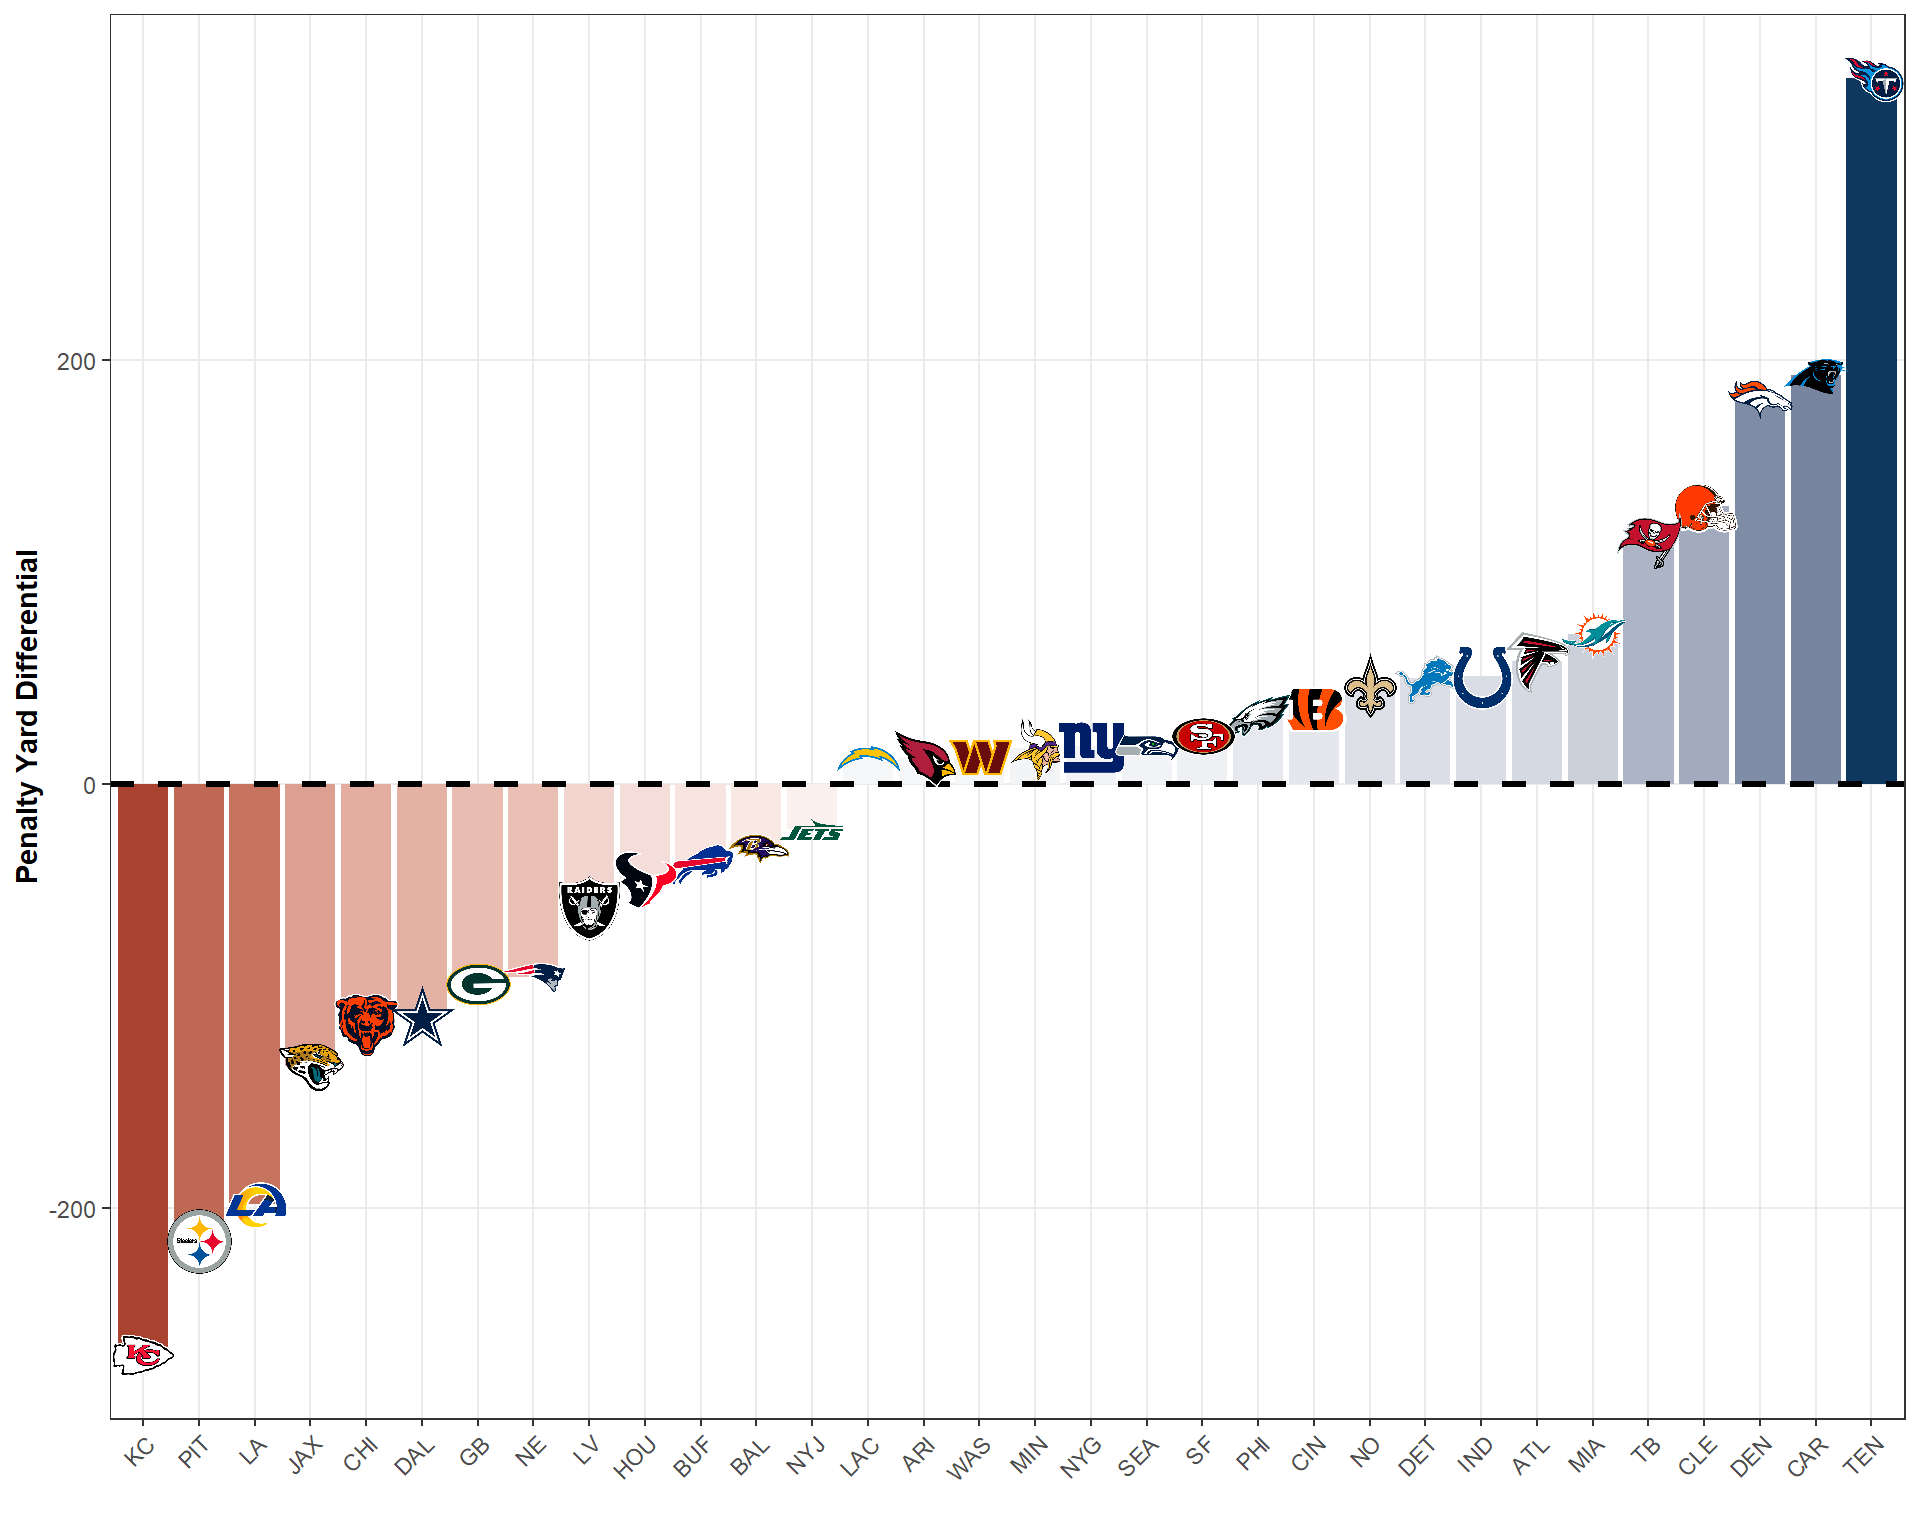
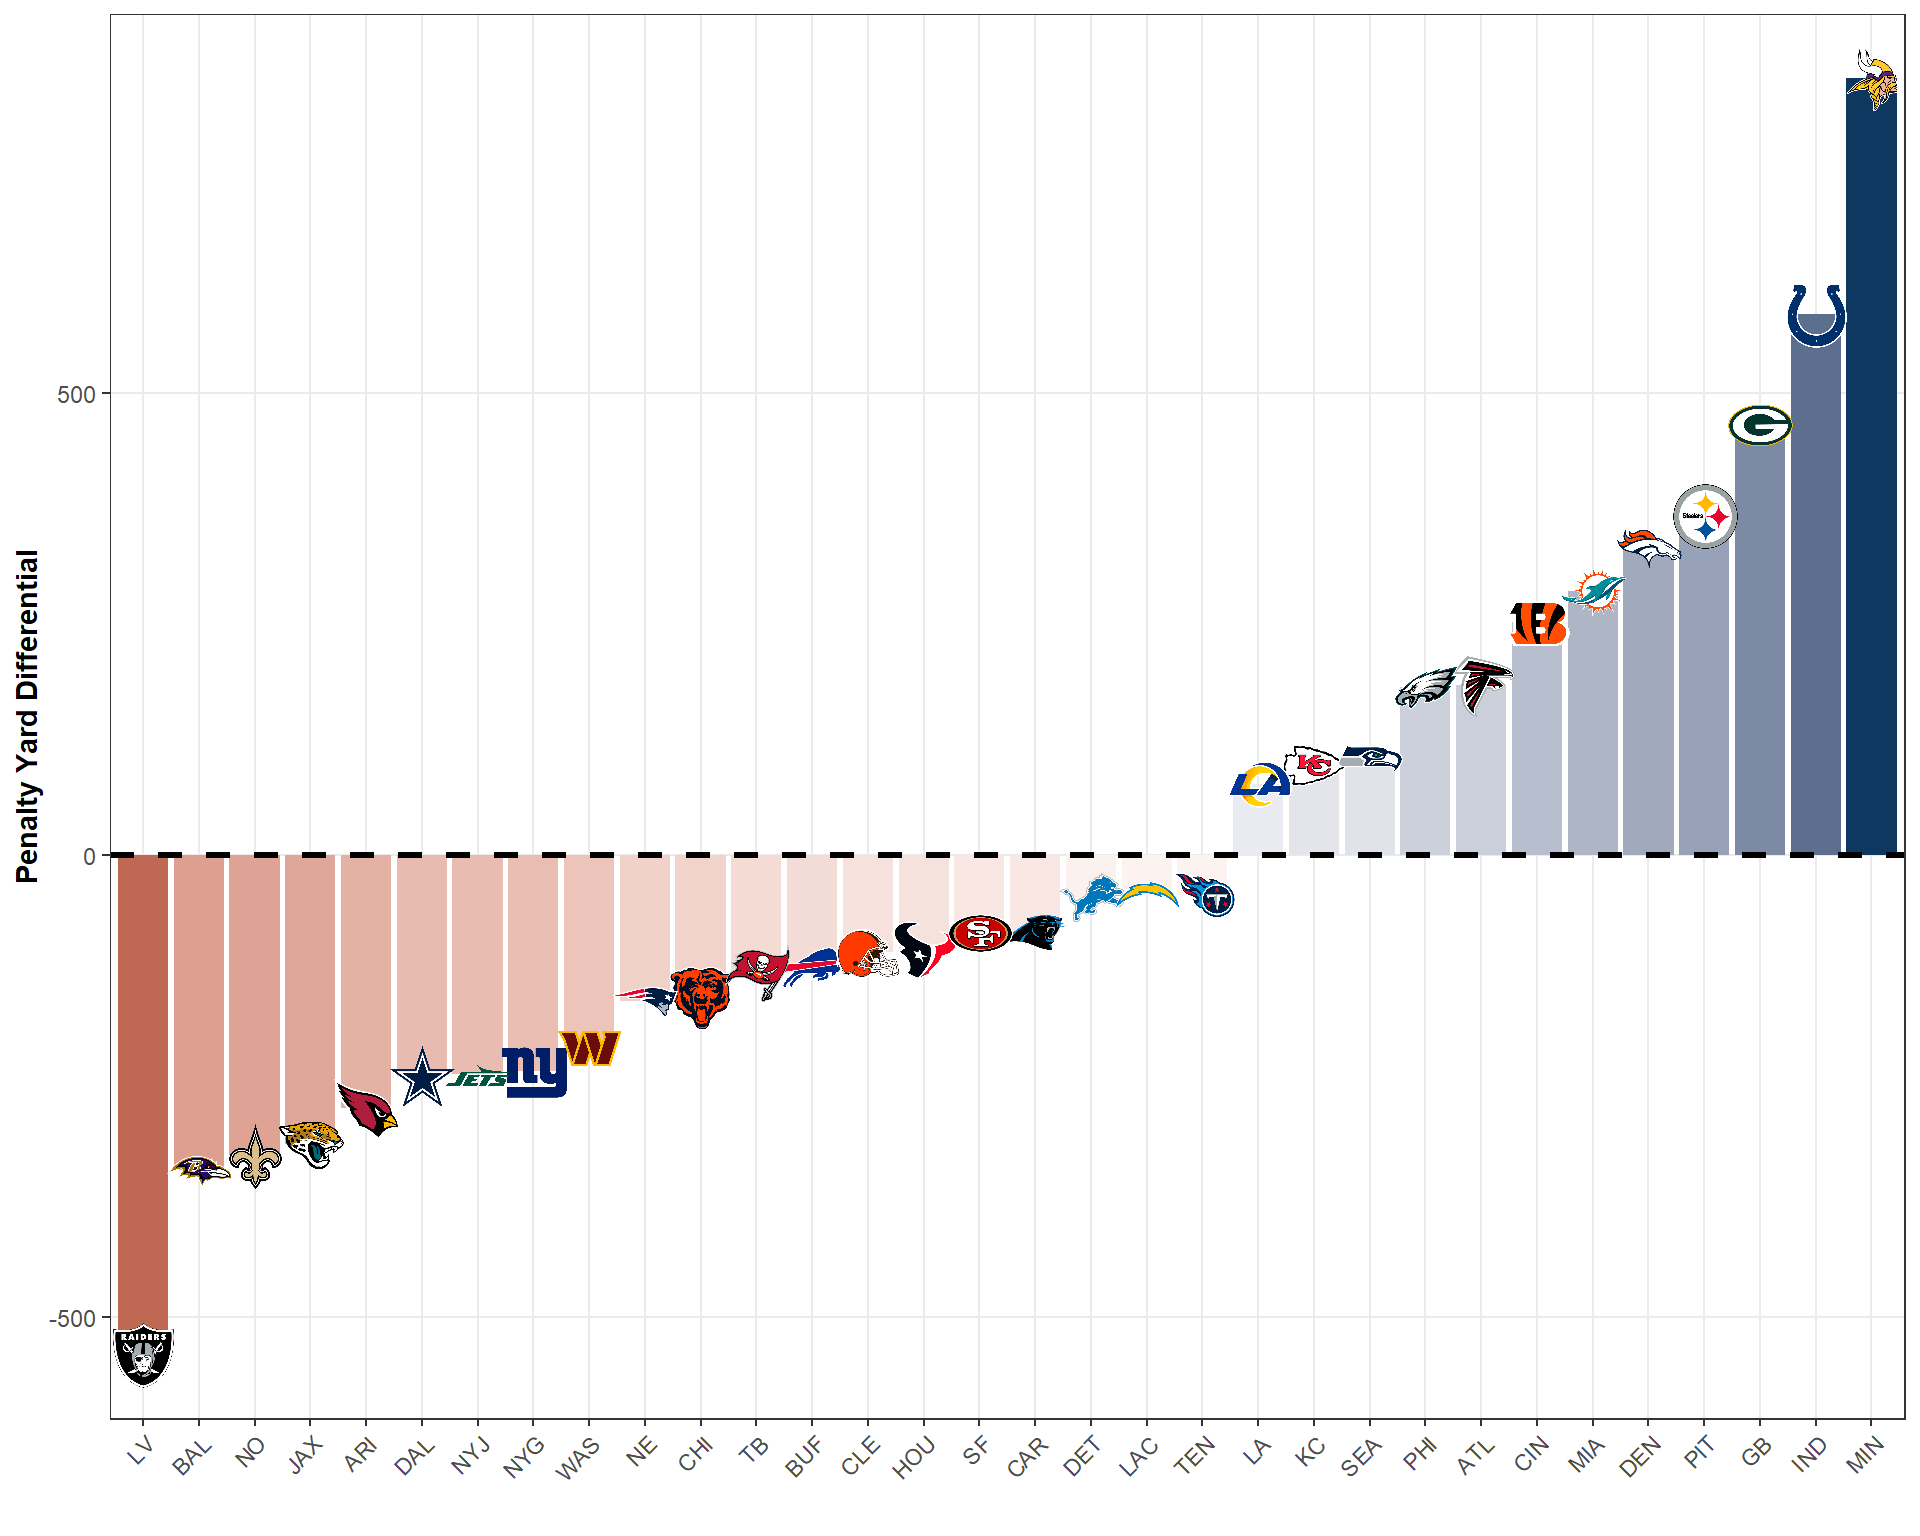
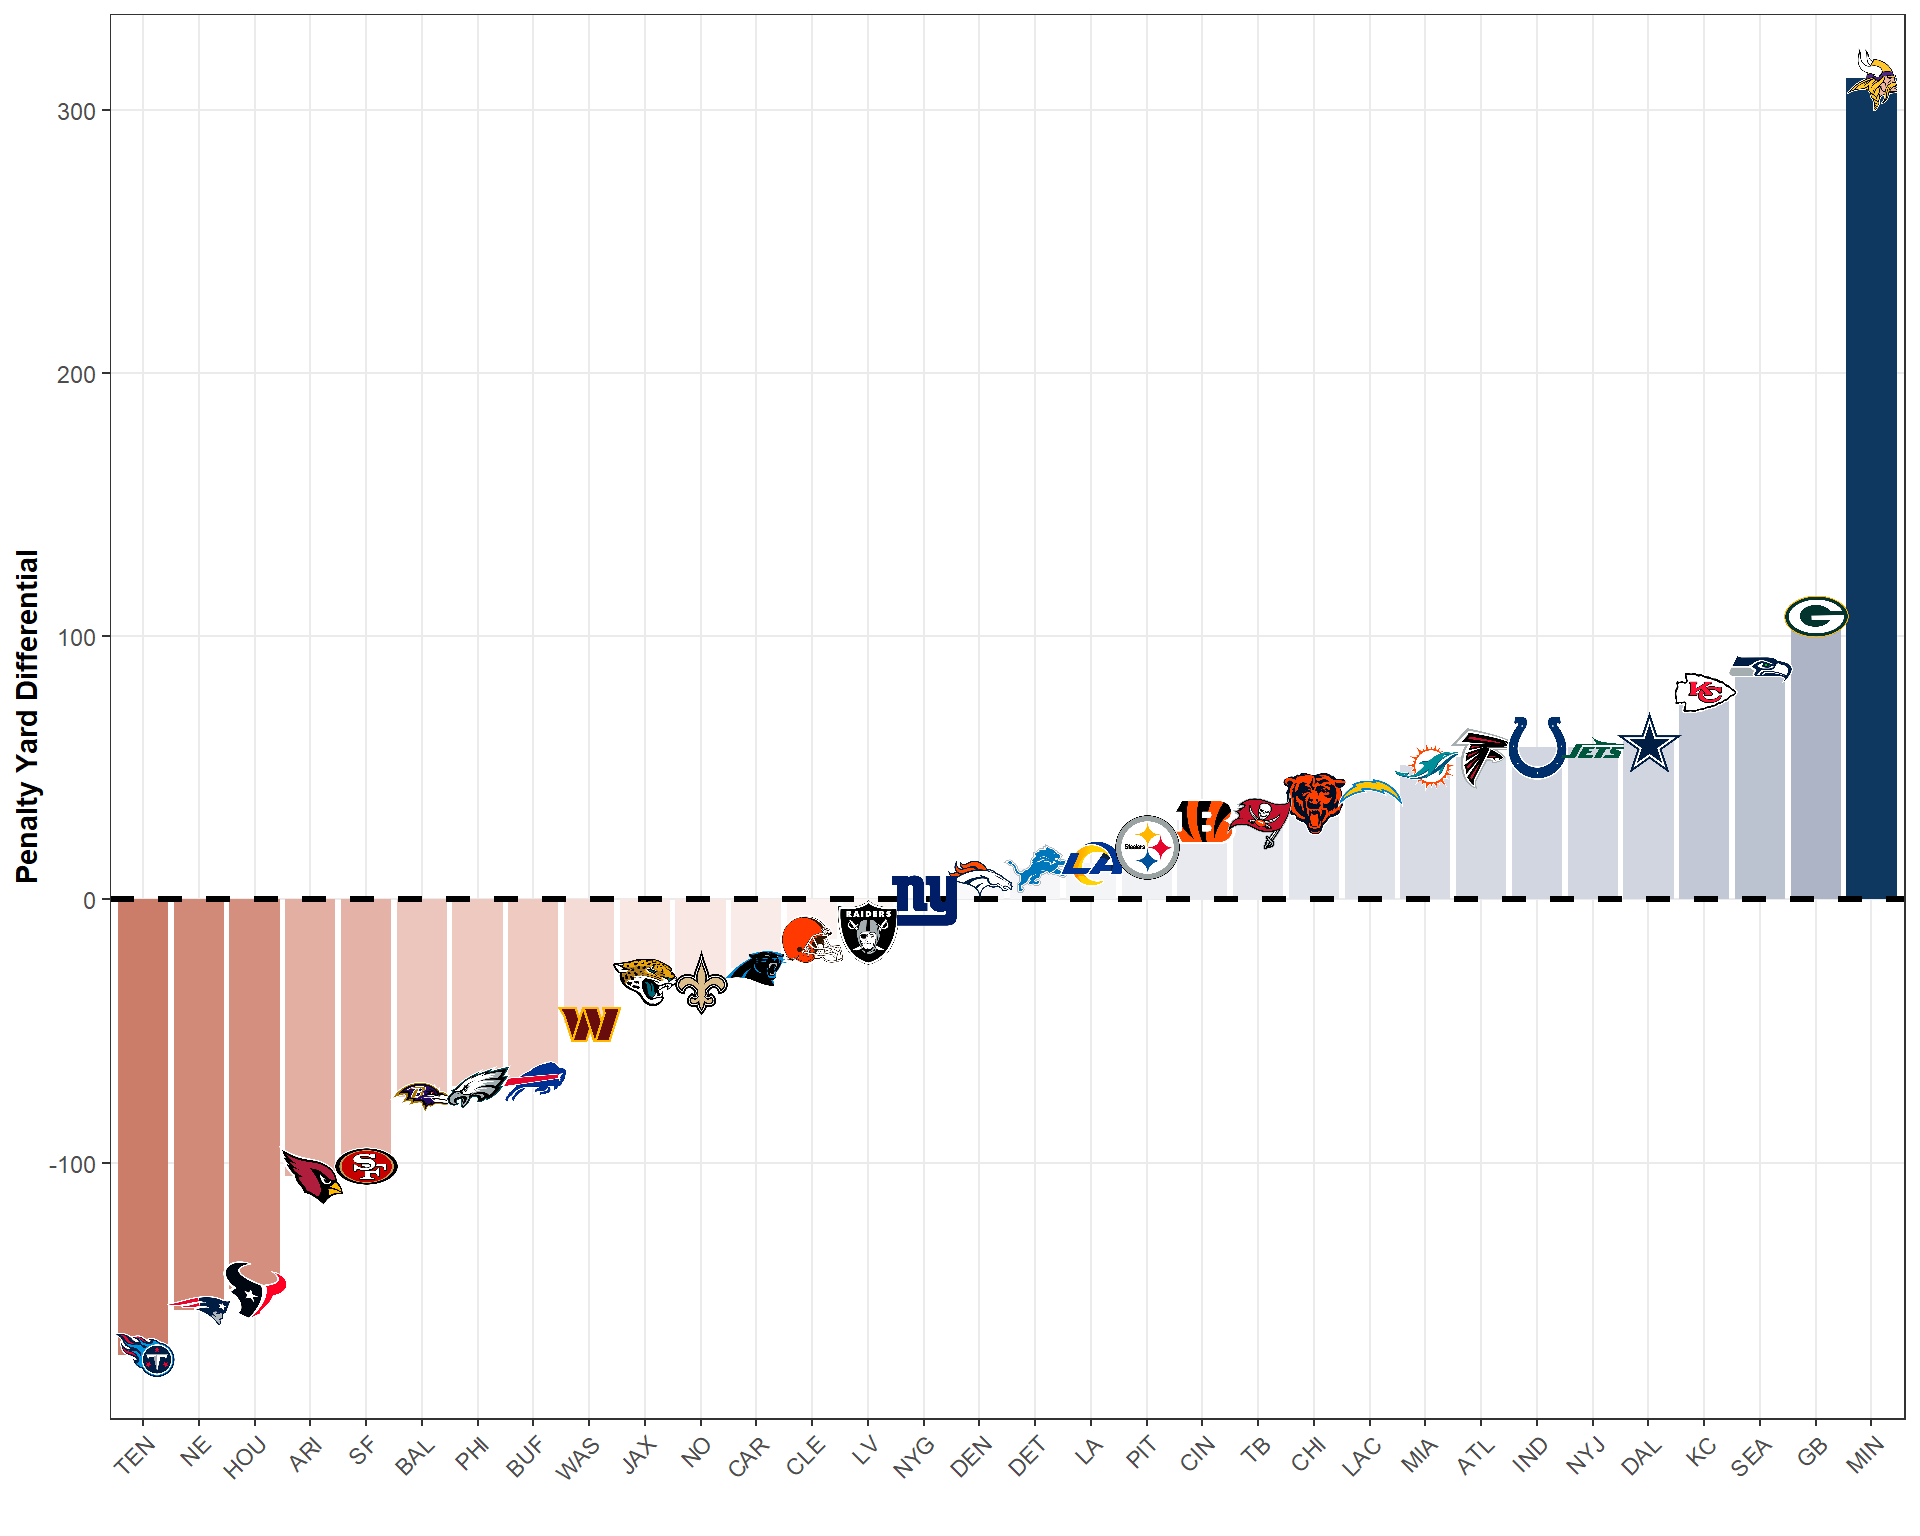
Lastly, to evaluate whether the Chiefs are helped by the refs in tough spots (so far, everything has indicated the opposite), let’s look at penalties that are called when a team is trailing within one score (7 points are less). When the game is close enough, perhaps the refs are more trigger happy to make certain calls or refuse to make certain calls in order to benefit the Chiefs.
Code
# Calculate Penalty Yard Differential by Teampenalty_differential_2018_2024_trail <- pbp_data_2018_2024 %>%filter(score_differential >=-7& score_differential <=0) %>%# Only Keep Penalty Playsfilter(penalty ==1&!is.na(penalty_yards)) %>%# Create a Long Form Version with a "Team" Column and a Possession/Defense Dummygather(key ="side", value ="team", posteam, defteam) %>%mutate(side_dummy =ifelse(side =="posteam", "offense", "defense")) %>%# Modify Penalty Yards So That If the Team Committed the Penalty, It is Negative# For Them and Positive for Their Opponentmutate(penalty_yards_adjusted =case_when( penalty_team == team ~-penalty_yards, penalty_team != team ~ penalty_yards, TRUE~0 ) ) %>%# Collapse to the Game Levelgroup_by(game_id, team, season) %>%summarize(penalty_yard_differential =sum(penalty_yards_adjusted, na.rm =TRUE),.groups ='drop' ) %>%# Collapse to the Team Levelgroup_by(team) %>%summarize(total_penalty_yard_differential =sum(penalty_yard_differential, na.rm =TRUE),.groups ='drop' ) %>%left_join(team_logos, by =c("team"="team_abbr"))# Create a Diverging Bar Chartggplot(penalty_differential_2018_2024_trail, aes(x =reorder(team, total_penalty_yard_differential), y = total_penalty_yard_differential)) +geom_bar(stat ="identity", aes(fill = total_penalty_yard_differential)) +geom_hline(yintercept =0, linetype ="dashed", color ="black", linewidth =1.2) +geom_image(aes(image = team_logo_espn), size =0.05) +scale_fill_gradient2(low ="#8b0100", high ="#0f3860",midpoint =0 ) +labs(x ="",y ="Penalty Yard Differential" ) +blog_theme() +theme(axis.text.x =element_text(angle =45, hjust =1),legend.position ="none")
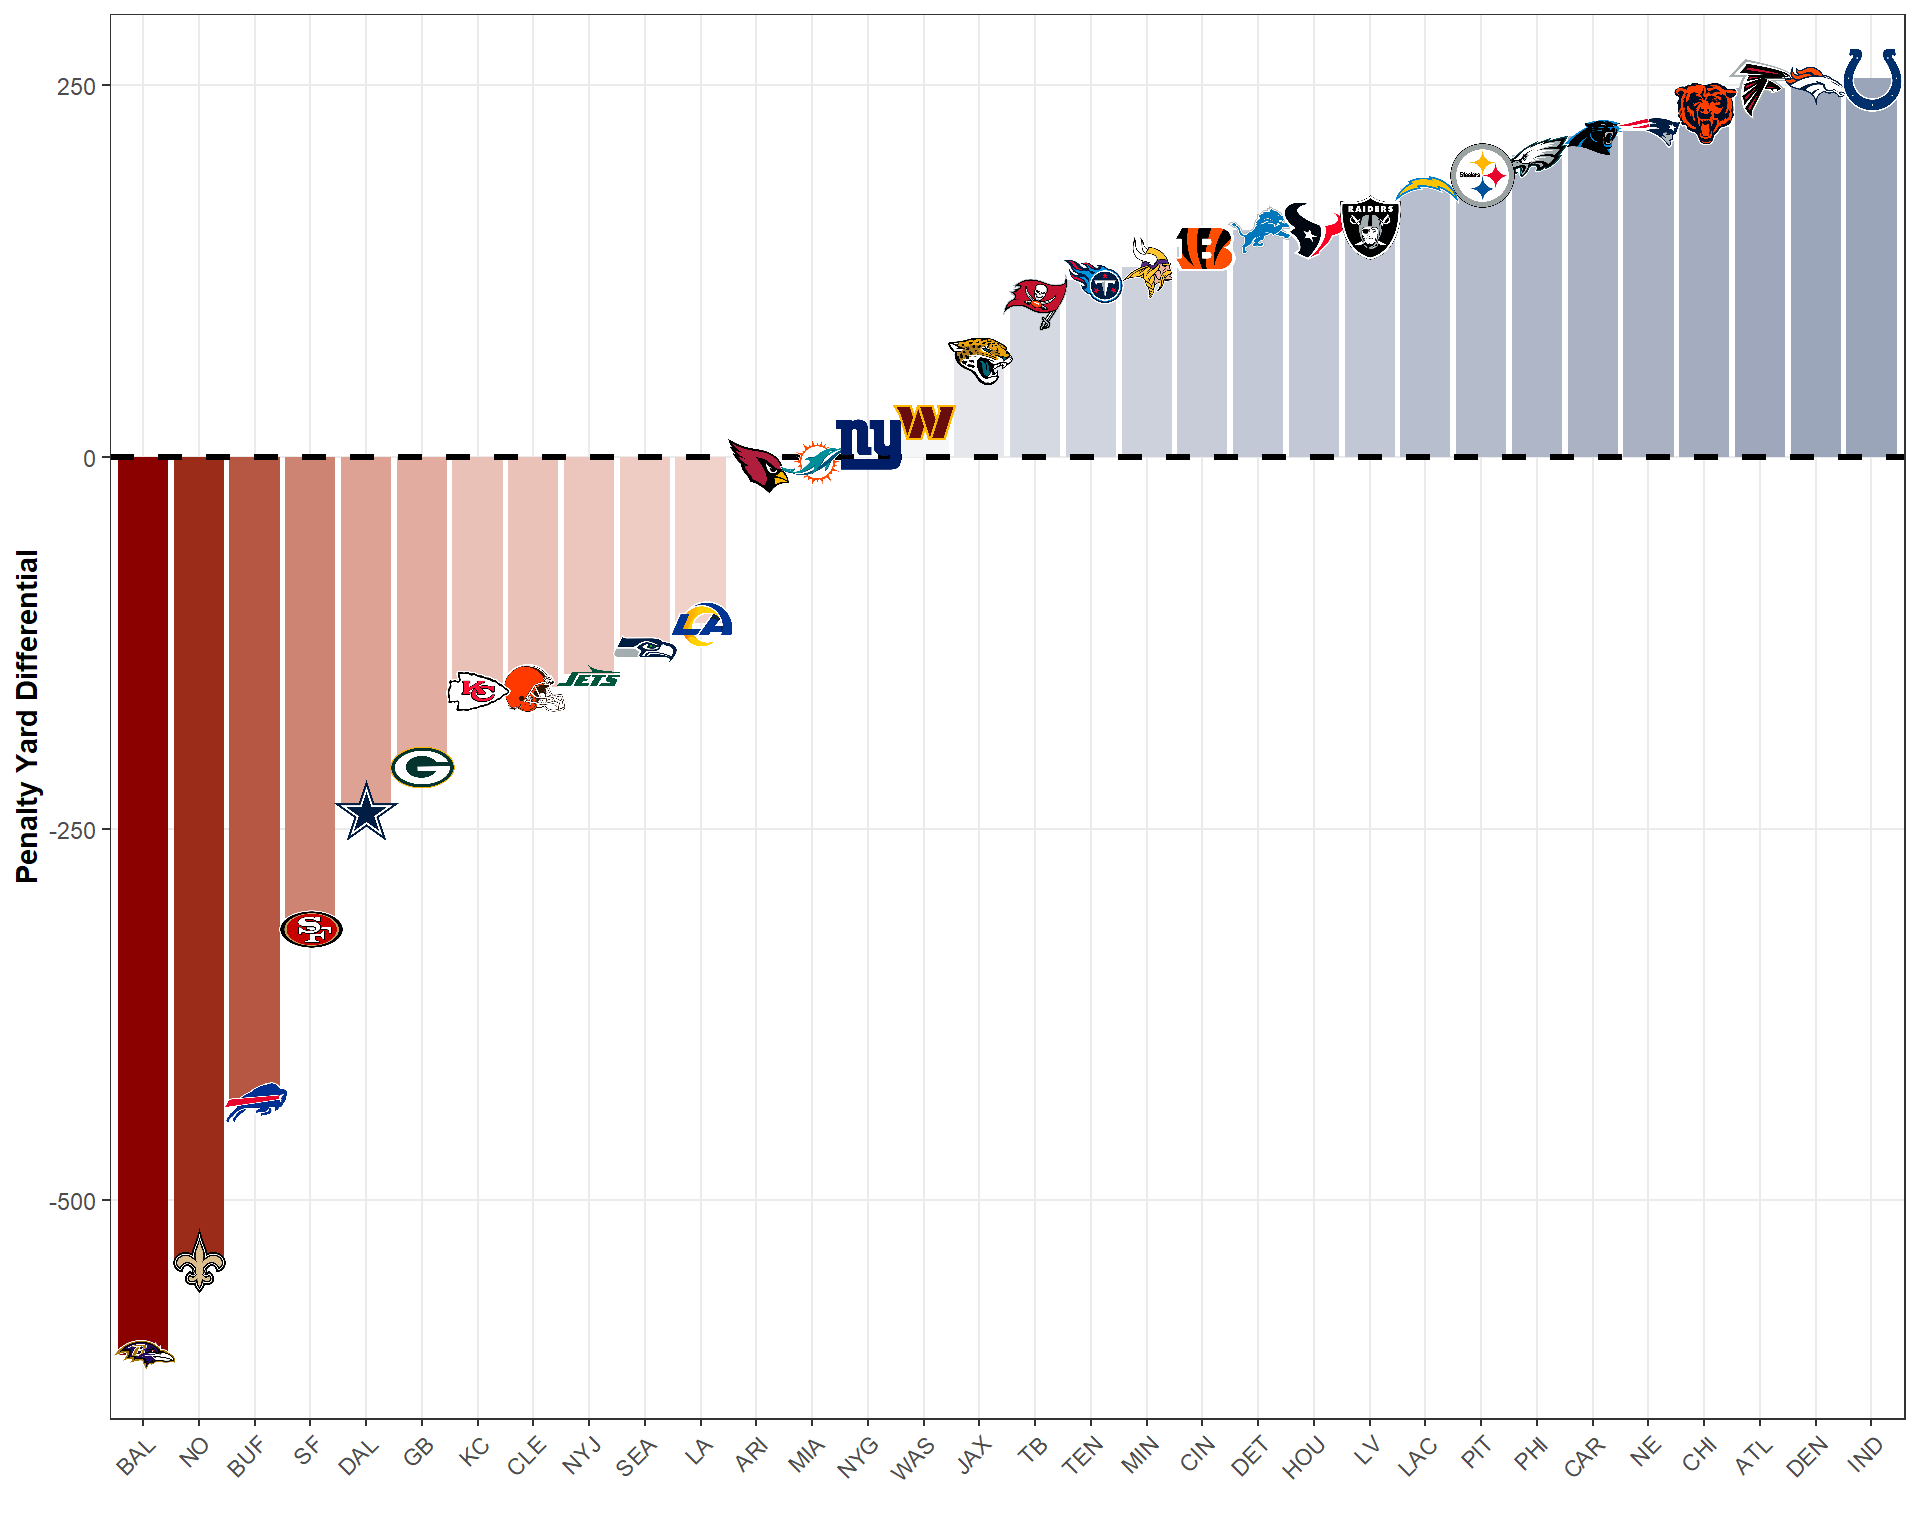
Penalty Yard Differential When Trailing (2018-2024)
Throughout Mahomes’s career, again, the Chiefs are just barely above average and, for the 2024 season, we actually get a shred of evidence that the Chiefs are positively impacted by ref calls. However, I would stress that, if one wants to make a statement like “the refs favor the Chiefs” based on one statistic, that conviction should also suggest that the NFL is rigging the game in favor of other teams like the Vikings, Colts, Packers, etc. I don’t think anyone thiks that…
Code
# Calculate Penalty Yard Differential by Teampenalty_differential_2024_trail <- pbp_data_2024 %>%filter(score_differential >=-7& score_differential <=0) %>%# Only Keep Penalty Playsfilter(penalty ==1&!is.na(penalty_yards)) %>%# Create a Long Form Version with a "Team" Column and a Possession/Defense Dummygather(key ="side", value ="team", posteam, defteam) %>%mutate(side_dummy =ifelse(side =="posteam", "offense", "defense")) %>%# Modify Penalty Yards So That If the Team Comitted the Penalty, It is Negative# For Them and Positive for Their Opponentmutate(penalty_yards_adjusted =case_when( penalty_team == team ~-penalty_yards, penalty_team != team ~ penalty_yards, TRUE~0 ) ) %>%# Collapse to the Game Levelgroup_by(game_id, team, season) %>%summarize(penalty_yard_differential =sum(penalty_yards_adjusted, na.rm =TRUE),.groups ='drop' ) %>%# Collapse to the Season Levelgroup_by(team) %>%summarize(total_penalty_yard_differential =sum(penalty_yard_differential, na.rm =TRUE),.groups ='drop' ) %>%left_join(team_logos, by =c("team"="team_abbr"))# Create a Diverging Bar Chartggplot(penalty_differential_2024_trail, aes(x =reorder(team, total_penalty_yard_differential), y = total_penalty_yard_differential)) +geom_bar(stat ="identity", aes(fill = total_penalty_yard_differential)) +geom_hline(yintercept =0, linetype ="dashed", color ="black", linewidth =1.2) +geom_image(aes(image = team_logo_espn), size =0.05) +scale_fill_gradient2(low ="#8b0100", high ="#0f3860",midpoint =0 ) +labs(x ="",y ="Penalty Yard Differential" ) +blog_theme() +theme(axis.text.x =element_text(angle =45, hjust =1),legend.position ="none")
Penalty Yard Differential When Trailing (2024)
Claim 3: Do the Refs Protect Patrick Mahomes?
At this point, it should be very obvious that the refs, overall, do not favor the Chiefs and, in addition, they do not favor the Chiefs in tight spots. This is apparent throughout Mahomes’s entire career and in the current 2024 NFL season. But what we’ve looked at so far are team-level stats. Patrick Mahomes is becoming (already is?) the face of the NFL and perhaps the league wants to protect their “golden boy poster child”.
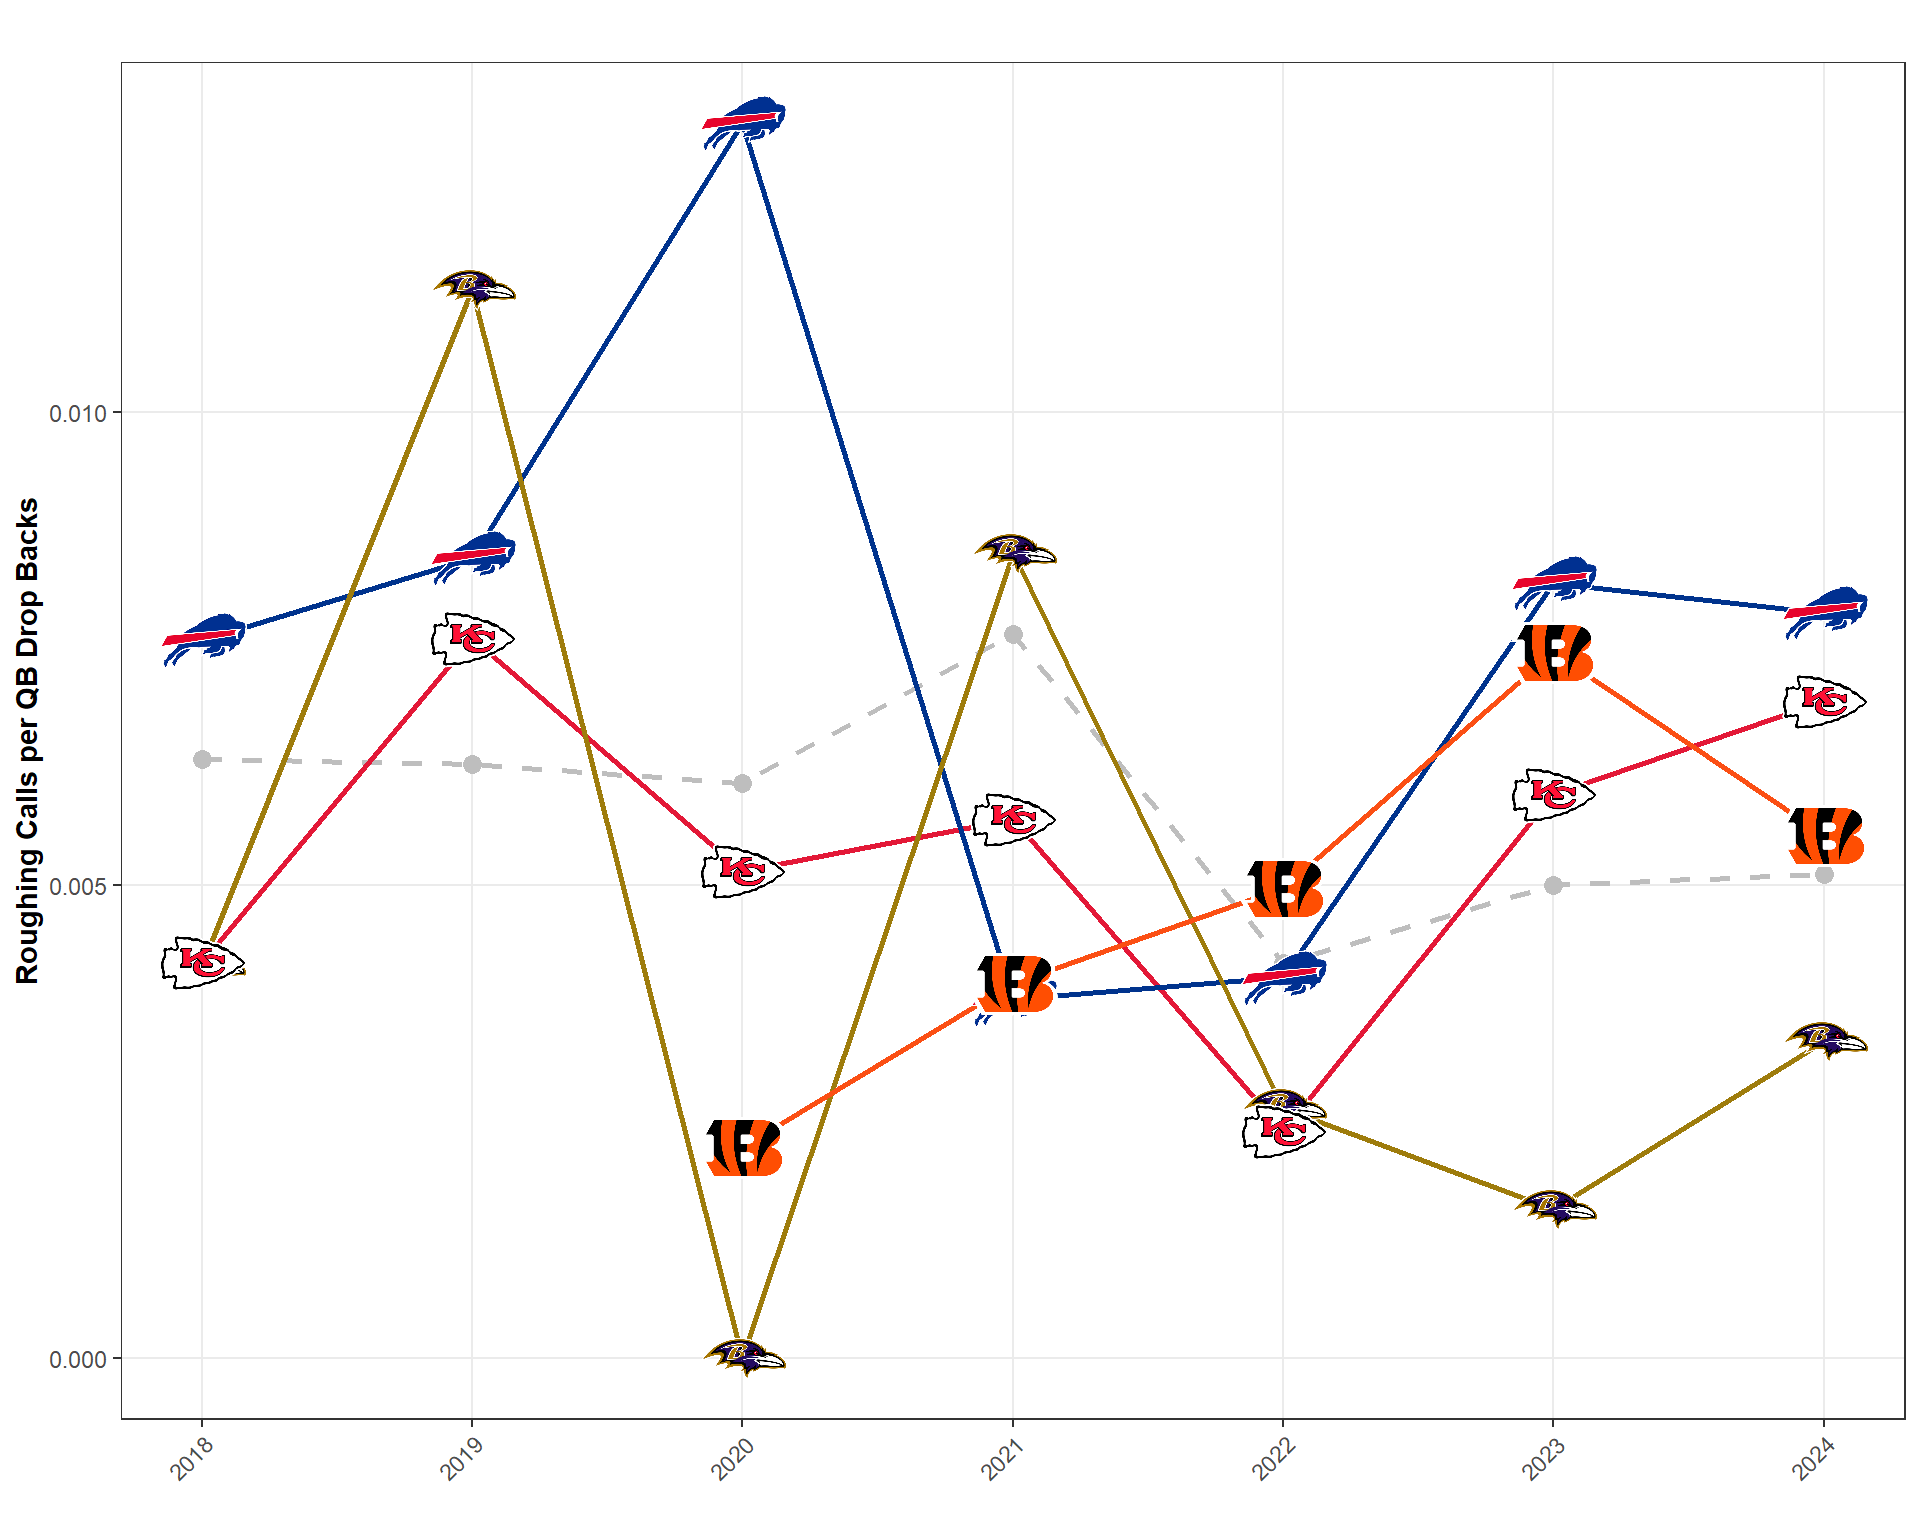
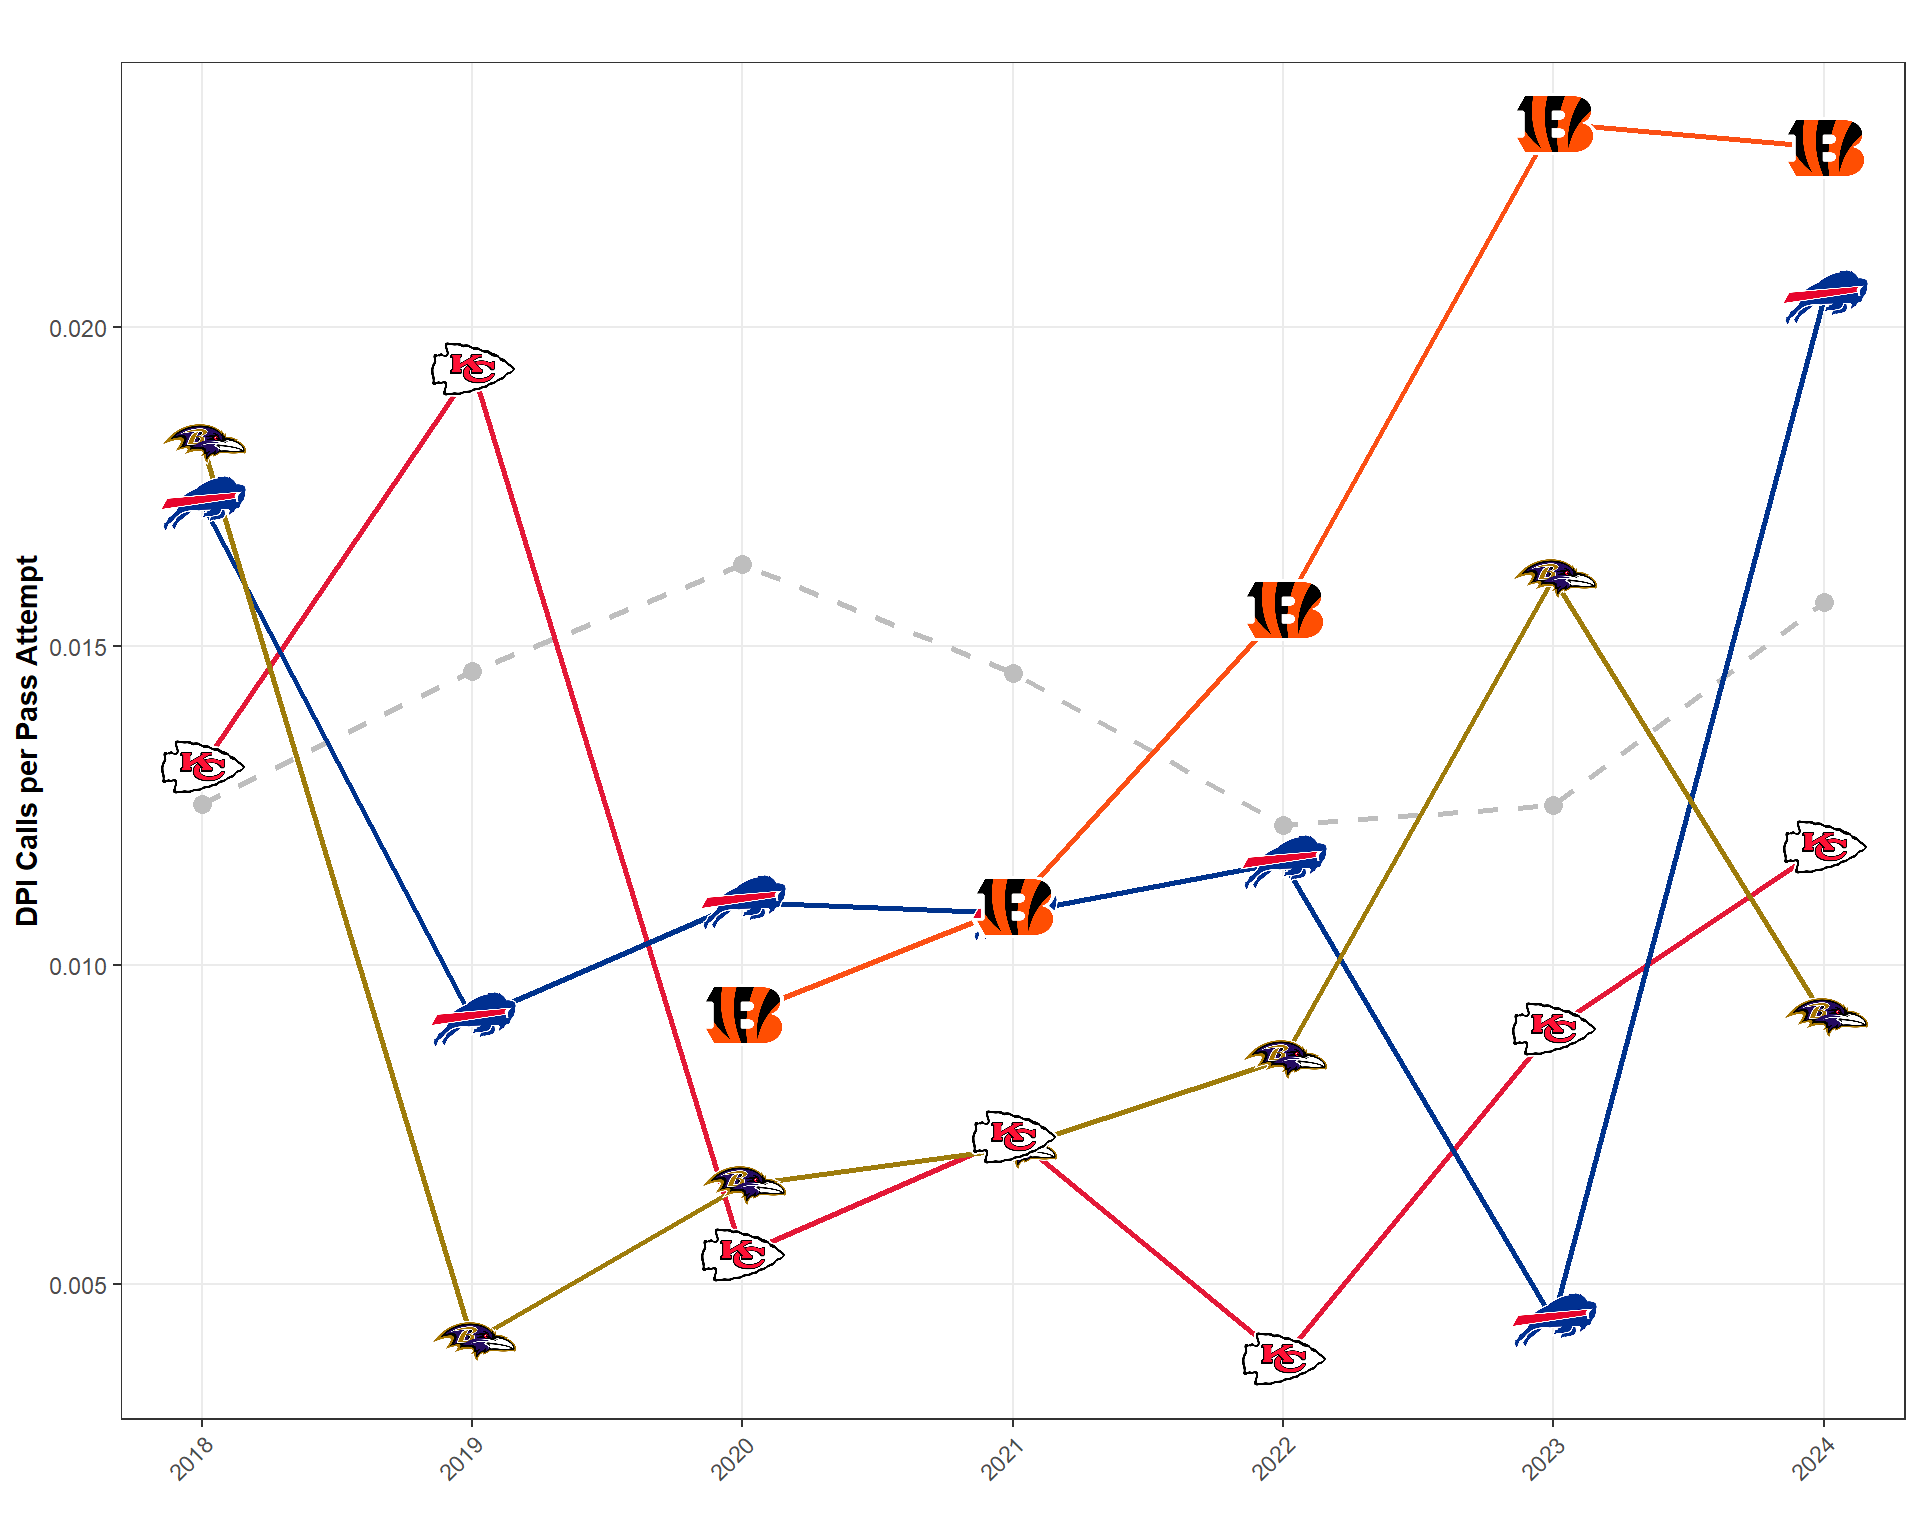
To evaluate this, I took a look at roughing the passer and defensive pass interference calls. If the refs wanted to protect Mahomes, surely Mahomes would have a higher rate of roughing the passer calls go in his favor. In addition, if the league wanted to help out the Chiefs, surely pass attempts by Mahomes would result in a higher rate of “fluke” defensive pass interference calls being made. Below, I plot the average number of roughing the passer calls (standardized by quarterback drop-backs) and the average number of defensive pass interference calls (standardized by passing attempts) over the 2018-2024 seasons. In particular, I compare Mahomes to some of his contemporaries who never seem to get heat for calls going their way…
As you can see, Mahomes goes above and below the average for roughing the passer calls per drop-backs. Certainly, his seasons do not suggest a systematic attempt of the refs to influence games to impact Mahomes. Josh Allen (I would say, among fans, the true “golden boy”) has finished with a lower roughing the passer call rate below Mahomes once over the past seven years! That certainly doesn’t fit the narrative! What about defensive pass intereference (DPI)?
Well, this information is even less convenient than the roughing the passer data for the Chiefs skeptics. Since Joe Burrow joined the league in 2020, he has finished with a higher DPI call rate than Mahomes in every season. Josh Allen has finished with a higher rate in 5/7 seasons. And even Lamar Jackson has finished with a higher DPI rate than Mahomes a majority of season (4/7). On Claim #3, it still seems like we fail to find any support for the “refs help out the Chiefs” claim.
Claim 4: Does Taylor Swift Impact the Game?
Ever since Taylor Swift and Travis Kelce became an item, NFL fans have claimed that her public association with the league somehow incentives the NFL to violate the integrity of the game. I’m not sure what the logic is here. So long as Swift and Kelce are together, I imagine she will still be attending games and publicly supporting the Chiefs, regardless of how well they perform. But, I still want to evaluate the claim.
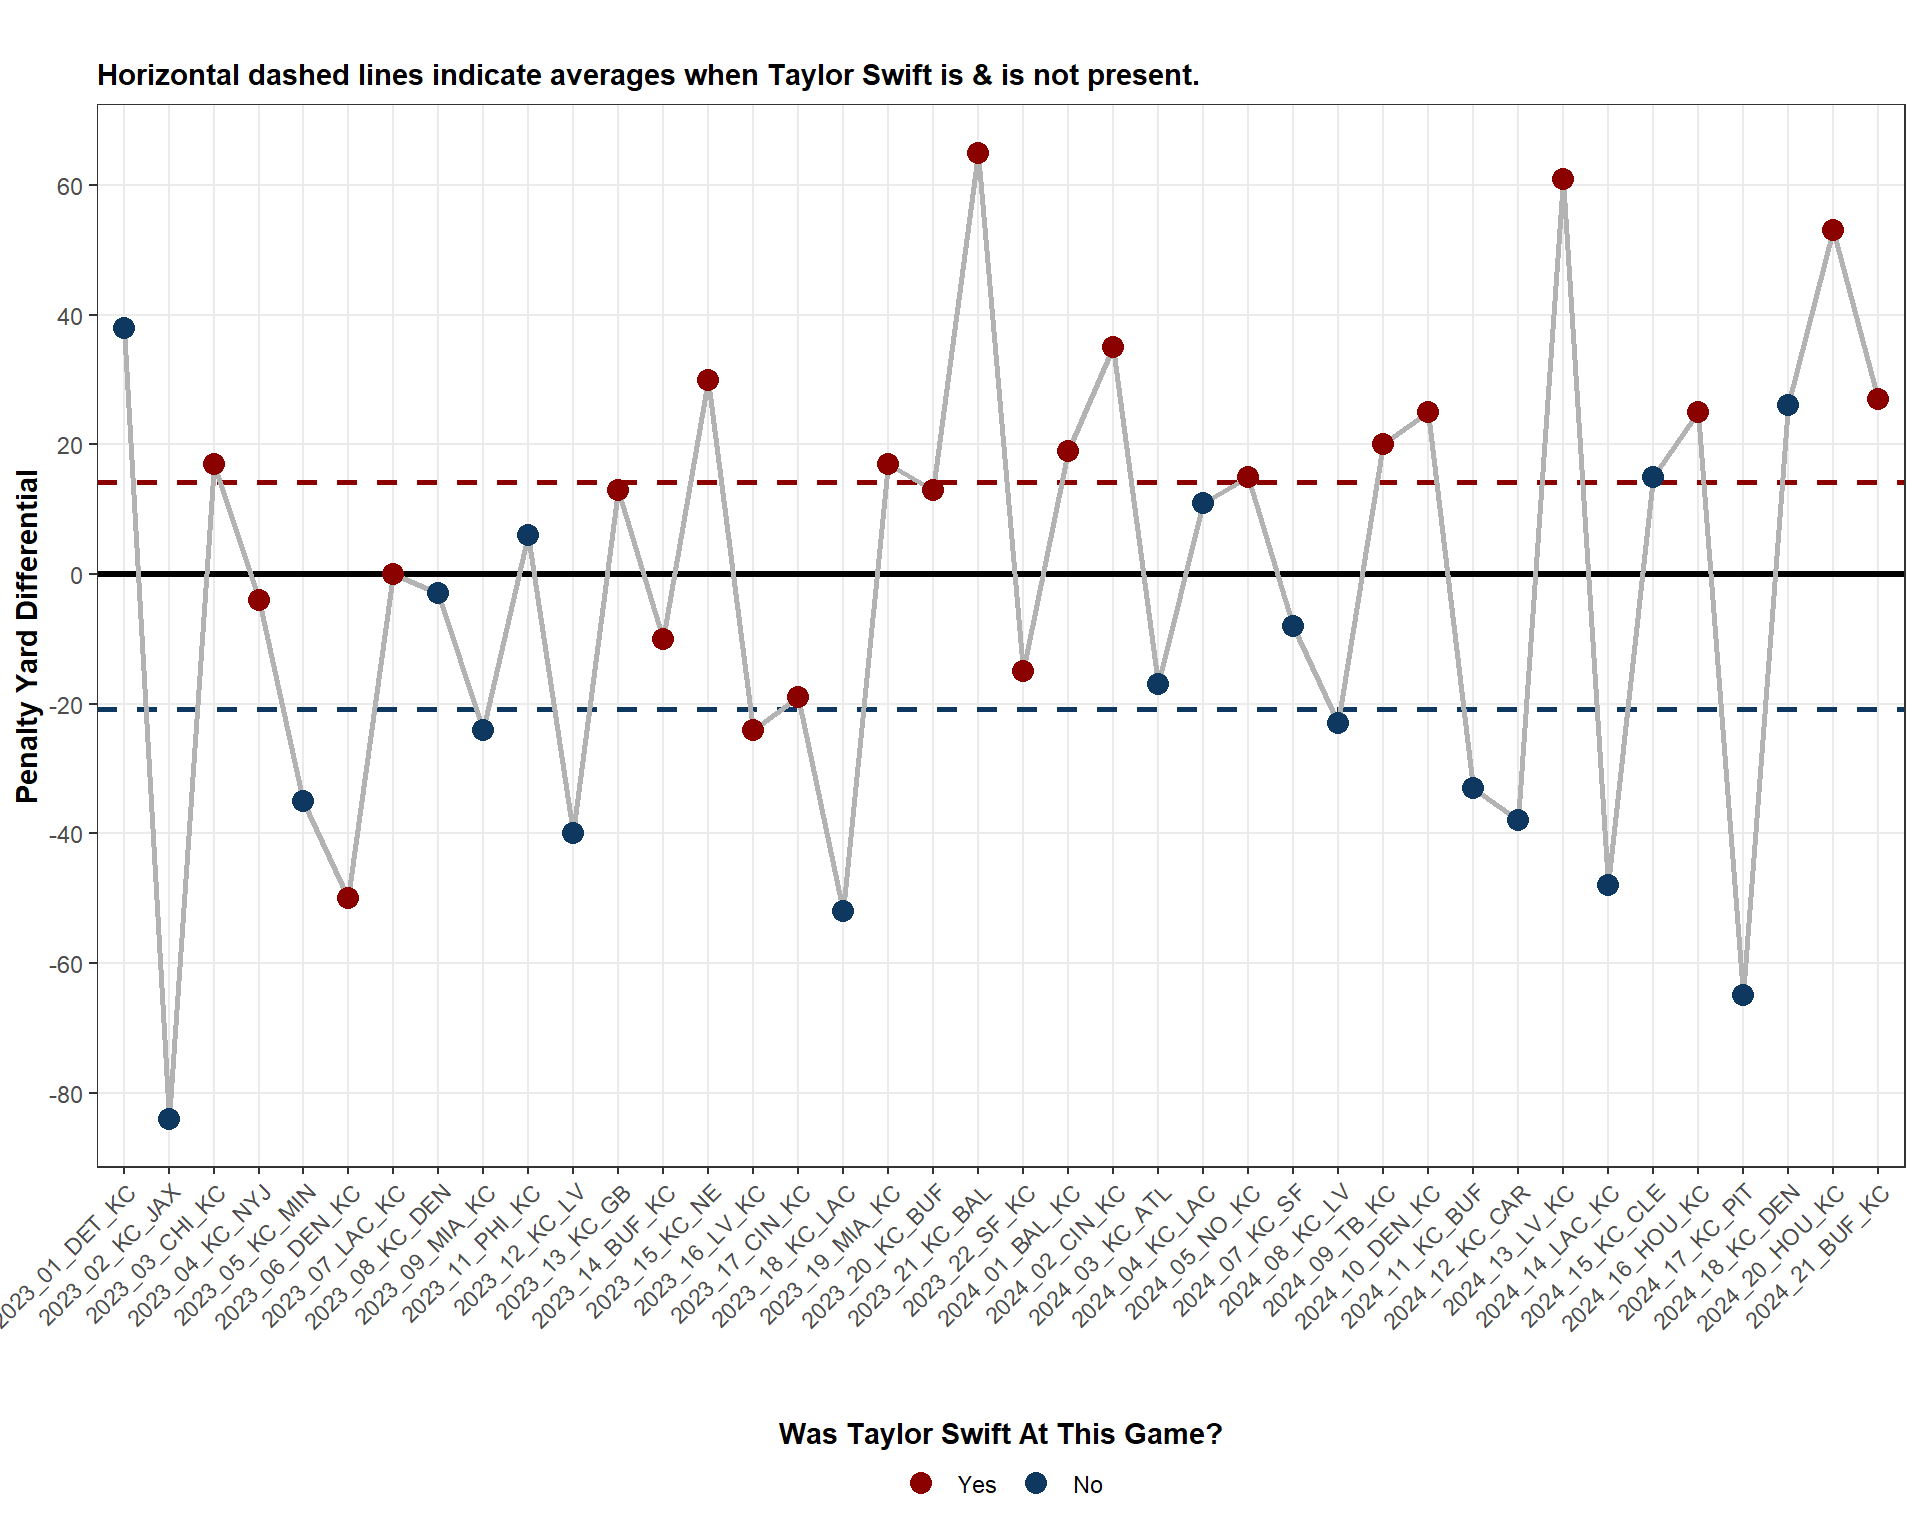
To do this, I made reference to this article which claims to document each Chiefs game that Taylor Swift has attended. Then, I looked at the PYD for each game that Swift attended and the PYD when Swift was not in attendance. You can see this information in the plot below.
Code
# Load Play-by-Play (PBP) Datapbp_data_2023_2024 <-load_pbp(seasons =2023:2024)penalty_differential_by_game <- pbp_data_2023_2024 %>%# Only Keep Penalty Playsfilter(penalty ==1&!is.na(penalty_yards)) %>%# Create a Long Form Version with a "Team" Column and a Possession/Defense Dummygather(key ="side", value ="team", posteam, defteam) %>%mutate(side_dummy =ifelse(side =="posteam", "offense", "defense")) %>%# Modify Penalty Yards So That If the Team Comitted the Penalty, It is Negative# For Them and Positive for Their Opponentmutate(penalty_yards_adjusted =case_when( penalty_team == team ~-penalty_yards, penalty_team != team ~ penalty_yards, TRUE~0 ) ) %>%# Collapse to the Game Levelgroup_by(game_id, team, season) %>%summarize(penalty_yard_differential =sum(penalty_yards_adjusted, na.rm =TRUE),.groups ='drop' ) %>%left_join(team_logos, by =c("team"="team_abbr")) %>%filter(team =="KC") %>%mutate(tay_tay =case_when( game_id =="2024_21_BUF_KC"~1, game_id =="2024_20_HOU_KC"~1, game_id =="2024_16_HOU_KC"~1, game_id =="2024_13_LV_KC"~1, game_id =="2024_10_DEN_KC"~1, game_id =="2024_09_TB_KC"~1, game_id =="2024_05_NO_KC"~1, game_id =="2024_02_CIN_KC"~1, game_id =="2024_01_BAL_KC"~1, game_id =="2023_22_SF_KC"~1, game_id =="2023_21_KC_BAL"~1, game_id =="2023_20_KC_BUF"~1, game_id =="2023_19_MIA_KC"~1, game_id =="2023_17_CIN_KC"~1, game_id =="2023_16_LV_KC"~1, game_id =="2023_15_KC_NE"~1, game_id =="2023_14_BUF_KC"~1, game_id =="2023_13_KC_GB"~1, game_id =="2023_07_LAC_KC"~1, game_id =="2023_06_DEN_KC"~1, game_id =="2023_04_KC_NYJ"~1, game_id =="2023_03_CHI_KC"~1,TRUE~0 )) %>%mutate(game_id =factor(game_id, levels = game_id),game_number =row_number())avg_differential <- penalty_differential_by_game %>%group_by(tay_tay) %>%summarize(avg_penalty_yard_differential =mean(penalty_yard_differential))ggplot(penalty_differential_by_game, aes(x = game_id, y = penalty_yard_differential)) +geom_hline(yintercept =0, color ="black", linewidth =1.2) +geom_hline(data = avg_differential,aes(yintercept = avg_penalty_yard_differential, color =factor(tay_tay)),linetype ="dashed", linewidth =1, show.legend =FALSE ) +geom_line(aes(group =1), color ="gray70", linewidth =1) +geom_point(aes(color =factor(tay_tay)), size =3.5) +labs(title ="",subtitle ="Horizontal dashed lines indicate averages when Taylor Swift is & is not present.",x ="",y ="Penalty Yard Differential",color ="Was Taylor Swift At This Game?" ) +scale_color_manual(values =c("1"="#8b0100", "0"="#0f3860"), labels =c("Yes", "No"), breaks =c("1", "0"),guide =guide_legend(title.position ="top") ) +scale_y_continuous(breaks =seq(-80, 80, by =20)) +blog_theme() +theme(plot.subtitle =element_text(face ="bold"),axis.text.x =element_text(angle =45, hjust =1),legend.position ="bottom",legend.title =element_text(hjust =0.5),legend.text.align =0.5 )
Taylor Swift Attendance and Penalty Yard Differential (2023-2024)
The colored horizontal lines reflect the average PYD when Taylor Swift is present (red) and when she is not present (blue). This is kind of fun, because you do see a difference and it isn’t entirely negligible. It’s a roughly 40-yard difference which means that, on average throughout the entirety of the 2023-2024 NFL season, the Chiefs got 40 more yards from penalties than their opponents did.
Is this evidence that, even if the NFL doesn’t rig games for the Chiefs, they are at least more trigger happy to help the Chiefs when Taylor is in attendance? Who knows? I would say that the difference in PYD is certainly interesting, but it’s impossible to know unless you adjust for other factors (I have a whole blog post about this.)
Why You Think the Game is Rigged
Overall, the overwhelming evidence suggests that the Chiefs are not being helped by the refs. In many cases, they rank very poorly in PYD, in some cases, they are right in the middle and, in a minority of cases, they are near the top in PYD. Further, plenty of other teams consistently record a larger PYD than the Chiefs (such as the Bills), but we fail to hear about any conspiracy regarding these teams. Why? Why might you think the league helps out the Chiefs when the data suggests otherwise?
This likely just has to do with both selection and confirmation bias. If you watch a disproportionately higher number of Chiefs games (which, you likely do because they are on prime-time more often), then you see more questionable ref calls being made. As you watch more games over time, you might begin to think that the Chiefs sure do get a lot of calls. However, by not watching other teams as often as the Chiefs, you are cognitively discounting how many other questionable calls are made in the favor of other teams. In other words, the pattern only seems suspicious because you’re not seeing how often these calls are made for other teams.
This leads to the second problem, which is confirmation bias. Once you have made the (false) connection that all the calls go the Chiefs’ way, every additional questionable call you see favor the Chiefs only goes to confirm your suspicions. Looking at the game like this makes you susceptible to arriving at false conclusions. You become so focused on the Chiefs, that you fail to see when other teams get away with missed calls or have their opponents called more often or have questionable calls go their way.
So, what can you take from this? I would say, stop complaining (because there is no reason to) and enjoy history being made! This team has been a blast to watch and, as a Dallas Cowboys fan and a resident of the greater Tyler, Texas area (where Mahomes grew up), I sincerely hope that the Chiefs do what they do best and send Philly to Cancun.